Custom interactive analysis on all Seven Bridges environments
This week we released Data Cruncher, an interactive analysis tool available on the Seven Bridges Platform, Cancer Genomics Cloud, and Cavatica. By enabling researchers to apply custom scripts in JupyterLab to data stored in the cloud, Data Cruncher supports interactive and collaborative bioinformatic analysis at scale.
Bringing custom interactive analysis to the cloud
Although some bioinformatic analyses are generally performed using standardized protocols and software pipelines, researchers often want to do open-ended exploration of their data. For example, after calling variants on a set of genomes in the cloud, a researcher might want to explore whether there are associations between the variants and different types of metadata. One way to do this involves downloading VCF and metadata files to a local environment, then using local software to plot the various combinations of variants and metadata. However, downloading large data sets can be impractical, and collaborating on local analyses is inconvenient.
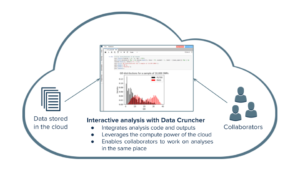
To streamline this process, Data Cruncher brings custom interactive analysis to the cloud. Within a project where data files are stored, users can initialize a computation instance and write custom Python, R, and Julia scripts using JupyterLab—an interactive environment that enables users to quickly see calculation and visualization results. Researchers can leverage the computational power of the cloud to analyze data, and collaborators can work on the same analysis files.
Examples of Data Cruncher interactive analyses
Data Cruncher enables a full range of analyses, from preliminary quality checks of variant calls to computationally intensive calculations that associate genomic and phenotypic data.
Quality control checks
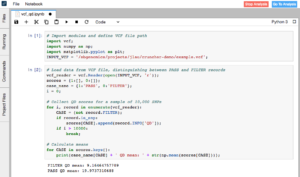
In this analysis, we called variants on data from a whole exome sequencing sample in the 1000 Genomes Project. We aligned FASTQ reads to the GRCh37 reference genome and performed variant calling, using a combined BWA and GATK workflow hosted on the Seven Bridges Platform.
Using just a few lines of Python code in Data Cruncher, we performed some quick quality checks on the variant calls contained in the output VCF file. We pulled a sample of 10,000 SNP calls and calculated descriptive statistics of their quality (QD) scores. As expected, the mean score for SNPs that passed and were considered true variants was higher than the mean score for SNPs that were filtered out by the variant caller (19.97 compared to 9.16).
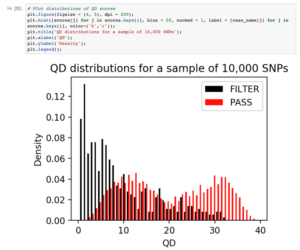
To check the QD scores in more detail, we visualized their distributions for both passed and filtered SNPs. QD scores for the SNPs that were filtered out had a skewed right distribution, matching our expectation that false-positive variants are of lower quality. The QD scores for passed SNPs were bimodal, with the peaks corresponding to heterozygous and homozygous SNP calls. We expected heterozygous SNP calls to have lower supporting evidence than homozygous SNP calls, resulting in lower confidence scores.
Within minutes, we were able to check that our variant calling workflow produced expected results. Because Data Cruncher integrates analysis code with calculation and visual results, as well as stores the analysis file in the same location in the cloud as all the data files, collaborators can easily run and add to the analysis.
Genetic clustering
For this analysis, we aimed to develop a machine learning model to identify the population of an unknown genome sample. To train the model, we used variant call data from phase 3 of the 1000 Genomes Project, which include over 2,000 genomes from the African, American, East Asian, European, and South Asian populations.
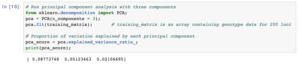
In Data Cruncher, we sampled 200 random loci on chromosome 1 and ran a principal component analysis in order to reveal clusters in the data. The percentages of variance in the data explained by the first, second, and third components were 8.8, 5.1, and 2.1%, respectively.
Next, we visualized the results and saw that there were four clusters in the data. In line with published studies on human genetic diversity, we observed that data from the African population were the most clearly separated from the rest.
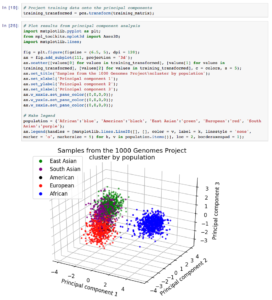
Given these results, we performed k-means clustering on the training data with four clusters, then used a nearest centroid approach to classify a test sample from the 1000 Genomes Project that had been excluded from the training set. Our model accurately determined the test sample’s population, demonstrating its potential to classify unknown samples.
By integrating analysis code with calculation and visualization results, Data Cruncher enables this type of interactive analysis that links genotypic and phenotypic data. The machine learning model can be improved by scaling up the number of loci sampled, an increasingly computationally intensive analysis that can be readily performed because of the available cloud compute resources.
Get started with Data Cruncher
Data Cruncher enables researchers to use custom scripts to perform interactive, collaborative analysis in the cloud. Contact us to learn how Seven Bridges can help implement interactive analysis of your data.
Users can learn more about how to use Data Cruncher in the Knowledge Centers for the Seven Bridges Platform, Cancer Genomics Cloud, and Cavatica.