Abstract
Reproducible -omics data interpretation, i.e. the derivation of actionable molecular biomarkers, is currently a major bottleneck in streamlined applications, obstructing the transformation of genomic information into valuable insights. Interpretation is still largely performed manually and slowly, in contrast to upstream processing of raw -omic data, which has significantly more conformed to streamlining and automation standards.
BioInfoMiner, available on the Seven Bridges Platform, enables unsupervised, data-driven interpretation and delivers robust biomarker signatures, describing key molecular processes and their driver genes. The signatures thus derived, combine minimal size with maximum information, ensuring that key molecular players will not be hidden among myriads of confounders, typically derived from common data analyses that derive large groups of differentially regulated genes.
Introduction
Biological big data, produced by high-throughput molecular techniques (i.e. next generation sequencing and microarrays) are known for their high volume, heterogeneity and complexity. Overwhelming data accumulation is currently a major issue in the field of genomics, as their complexity tends to constantly increase the possibility of false discovery.
Considerable efforts in the development of computational methods have recently resulted in significant progress in the field of genomic data analysis. However, at the same time, biological interpretation of processed data emerged as a major bottleneck in the genomic analysis chain, hindering the translation of processed data to actionable molecular biomarkers and promising drug targets.
Interpretation extends beyond typical genomic data analysis and implies the short-listing of few actionable biomarkers and molecular pathways with causal relation in regard to the phenotype, filtered out of a sea of confounders. For instance, it is not uncommon for a typical -omics experiment to derive thousands of differentially regulated genes, as the whole genome works as a dense network, perturbations on which propagate broadly.
For the prioritization of a subset of causal factors, a number of tools and methodologies have been introduced. However, biological interpretation has not yet conformed to automation standards as:
- There is no consensus methodology
- Is largely performed manually, heavily relying on expert prior knowledge
- Most applications have been designed as expert-support tools, rather than with automation and standardization in mind, the latter necessitating robust, insensitive methods to small changes of parameterization
- Many tools aggregate, but do not correct or process community annotations and databases, in order to feed classification algorithms, resulting in over-fitting and lack of generalization ability
- Use of ontologies, i.e. sets of terms encoding expert knowledge, is based on simple enrichment statistics, ignoring term hierarchy and yielding huge populations of bulk, unconnected descriptive terms, with no solid strategy for target prioritization and no further utility
BioInfoMiner is an application that enables data-driven, standardized and unsupervised interpretation of genomic data, suitable for streamlined processing. The tool performs prioritization of key processes and derives a compact signature, consisting of systemic processes and their respective driver, linker genes. BioInfoMiner’s key features are:
- BioInfoMiner integrates information and renders it suitable for biological conceptual modeling
- Performs modeling of biological information, including network topological analysis, intelligent synthesis and correction of sparse annotations
- Exploits the hierarchical structure of ontologies and pathways, instead of using them as independent, unstructured populations of terms
- Derives concise, robust, reproducible results, which are non-extremely sensitive to small changes in parameterization
- Results are more generalizable to independent datasets, as BioInfoMiner captures systemic network perturbations
Methodology
1) Intelligent Network-aided Mining of Critical Biological Information
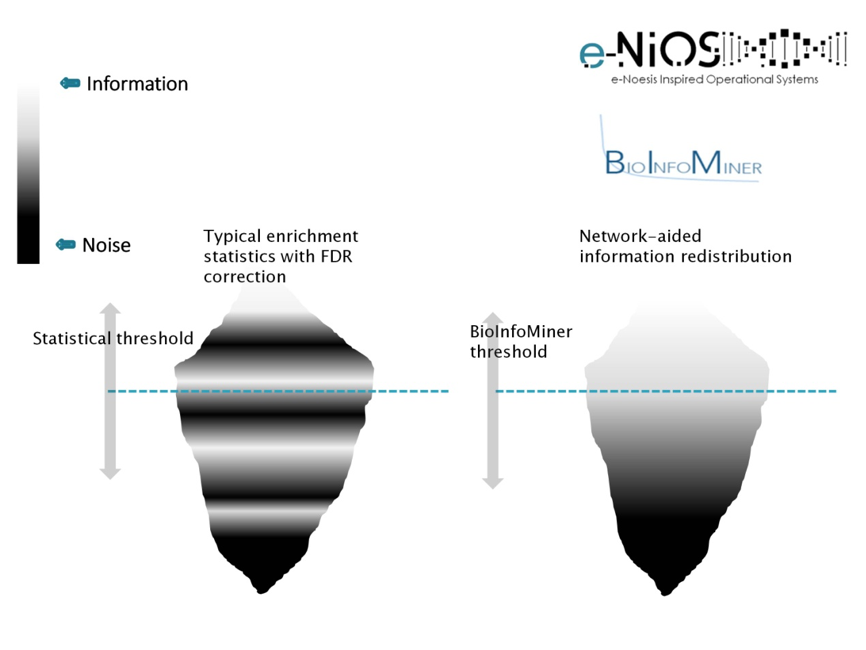
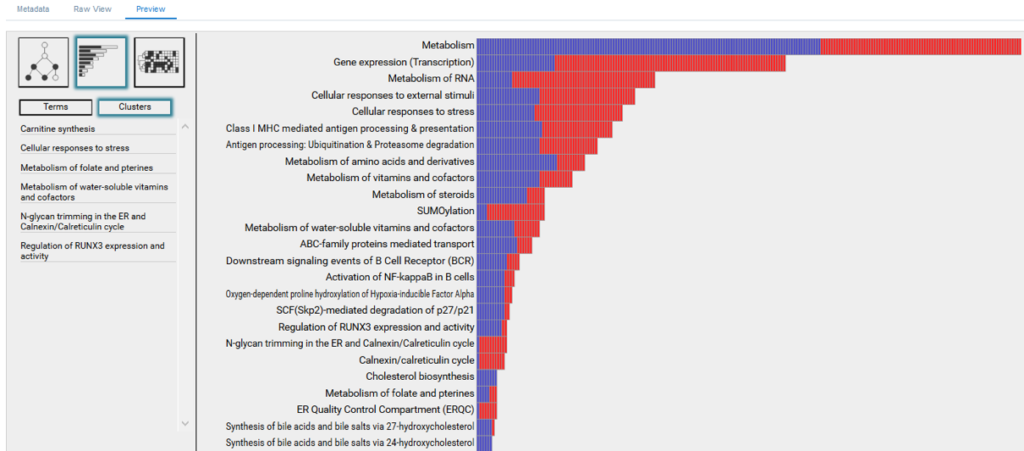
As information, we define molecular processes that drive cellular phenotypes, whereas as noise, we define confounding and randomly occurring processes. BioInfoMiner ranks detected processes according to their information content and repartitions their distribution, bringing to the surface systemic processes, and filtering out the random ones (Fig. 1). This redistribution is crucial for an efficient and clear biological interpretation. Use of common enrichment statistics (e.g. Fisher’s exact test) without this type of correction yields a huge number of false associations, obscuring biological interpretation.
BioInfoMiner interpretation methodology is based on a proprietary advanced semantics processing/computational intelligence algorithm, designed to transform the bulk community sets of annotation terms into solid, noise-free knowledge networks, without redundancy and other biases or inconsistencies that characterize publicly available ontologies and pathway databases. The output of BioInfoMiner hence consists of a minimal set of orthogonal (i.e. with minimized redundancy), systemic, cross-talking biological processes, accurately describing the underlying molecular phenotype in terms of interconnected networks.
2) Prioritization of Driver Genes
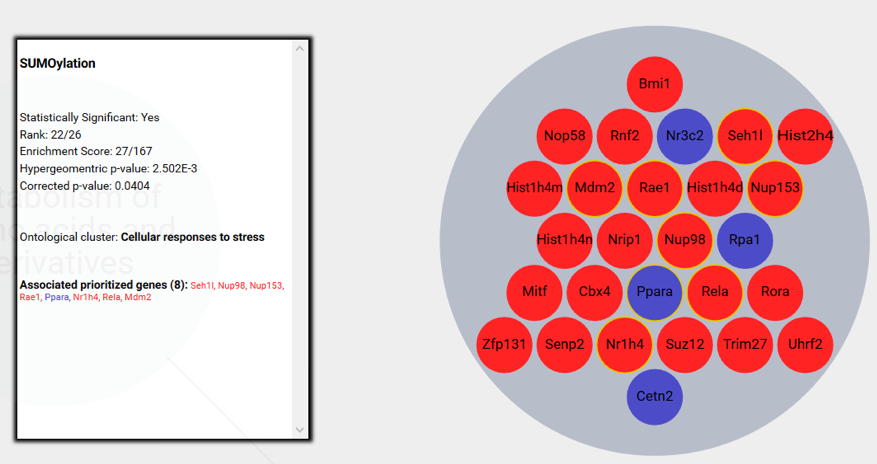
BioInfoMiner provides a list of prioritized genes that are mapped to the detected systemic processes. The ranking of genes is based on graph-theoretic methods, measuring their degree of connectivity in the modeled knowledge network. Thus, highly ranked genes are considered as master regulators, driving the cross-talking between distinct systemic processes. These genes are potential biomarkers for diagnostics, drug targeting and other applications that rely on the discovery of strong molecular-phenotype associations.
BioInfoMiner also reports direct binding interactors of the prioritized genes at the protein level, as they also constitute potential druggable targets with a similar but moderated impact.
3) Extraction of Robust Signatures
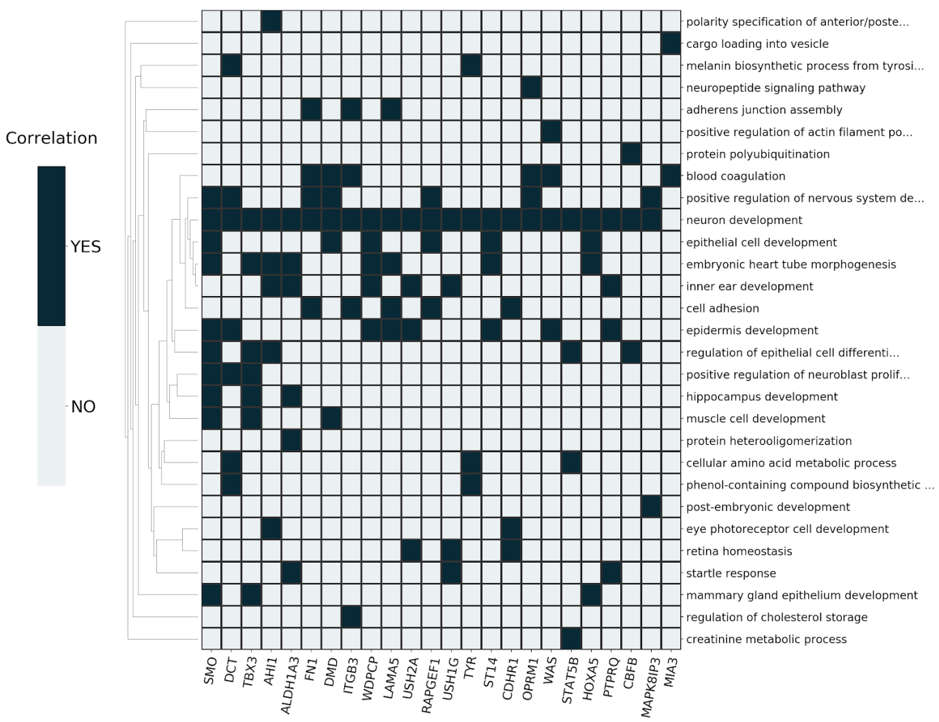
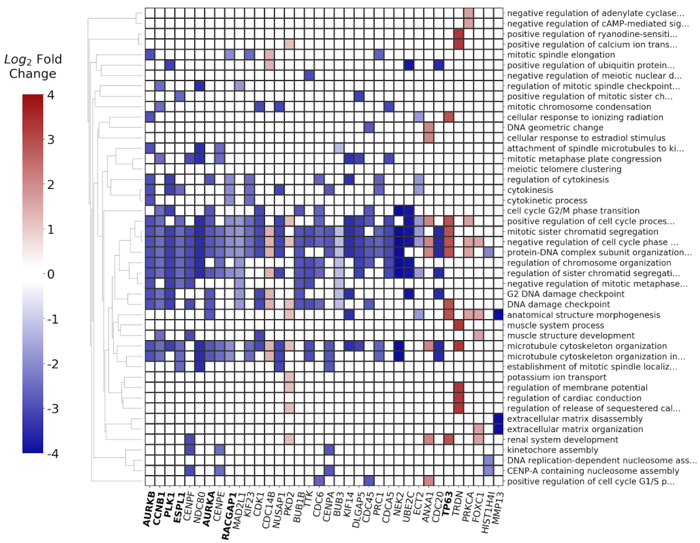
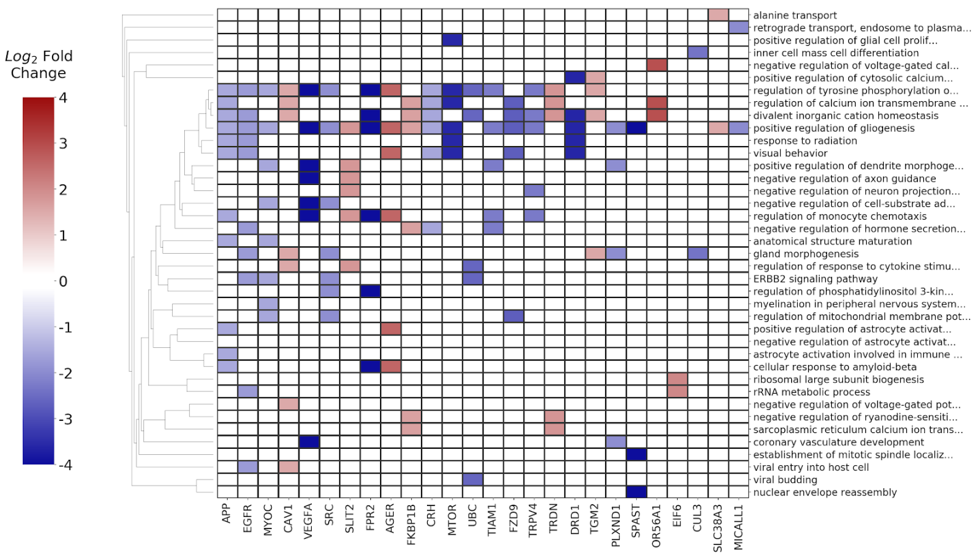
The derived signatures (Fig. 2) constitute deconvoluted projections of the input dataset on a modeled biological knowledge network, giving accurate insights into the molecular processes underlying complex phenotypes.
The signatures consist of a mapping of prioritized, master regulator genes to systemic processes and can be further used for:
- Drug targeting or repurposing (e.g. comparison with drug perturbation signature databases)
- Prioritization of targets for early biomarker discovery
- Cohort stratification
- Systemic interpretation of underlying molecular processes
- As a biologically-inspired feature selection method that takes into account network topology, for feeding classification and machine/deep learning algorithms, ensuring better generalization capability
Signatures can be currently derived on three distinct layers:
- Biological Processes
- Phenotypes (Human and Mammalian)
- Reactome Pathways
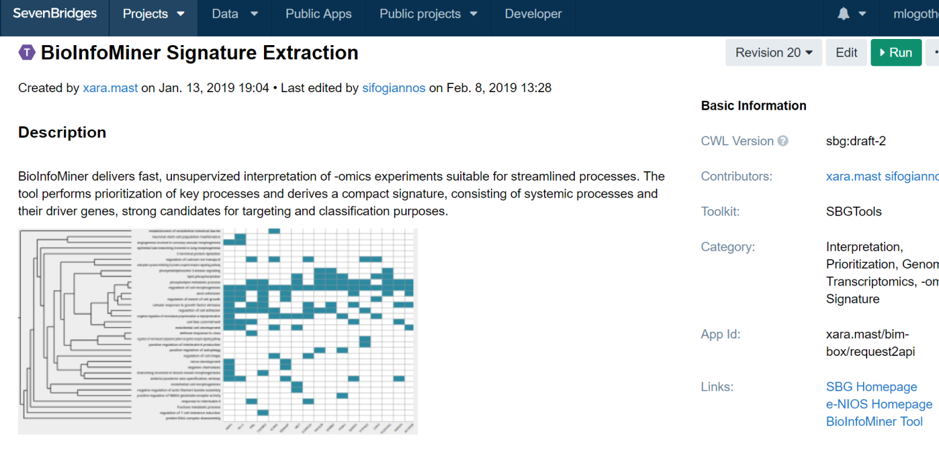
BioInfoMiner App on the Seven Bridges Platform
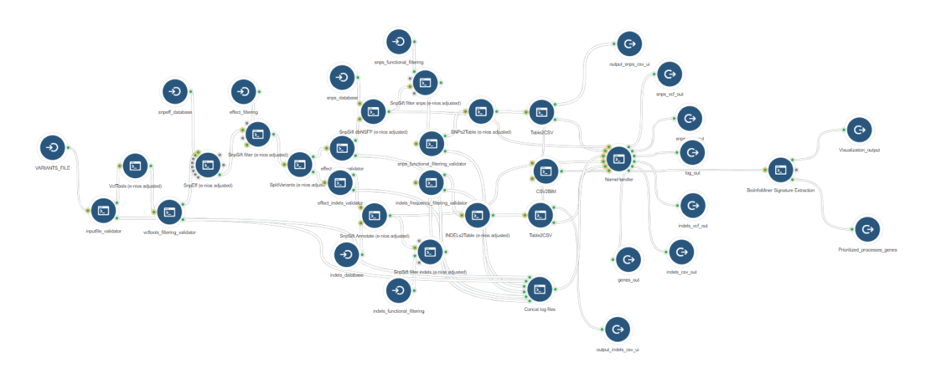
BioInfoMiner Signature Extraction is available as an app on the Seven Bridges Platform (Fig. 3). It supports a variety of organisms such as Homo sapiens, Mus musculus, Rattus norvegicus, Saccharomyces cerevisiae and Arabidopsis thaliana.
1) Inputs
Files
- Dataset – Input gene list file (txt, csv)
Parameters
- BioInfoMiner API Token (obtained from an account at https://bioinfominer.com)
- BioInfoMiner Project ID
- ID Type (gene symbol, Ensembl gene ID)
- Organism
- Selection of Ontology Terms
- Fold change type (log/linear) and corresponding p-values (optional)
- Experiment title
2) Outputs
- List of prioritized processes (csv)
- List of prioritized genes (csv)
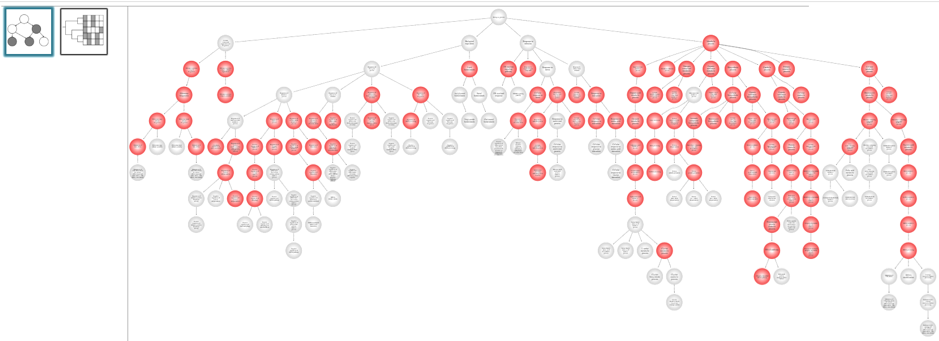
- Visualization ofprioritized processes and mapped genes (Fig. 4)
- Visualization of the signature composed of systemic processes and master regulator genes (Fig. 5)
a)
b)
c)
3) Integration with Upstream Genomic Analysis Workflows
The BioInfoMiner Signature Extraction module can be integrated with any upstream pipeline that provides lists of differentially regulated genes. For instance:
- Whole Exome Sequencing (genes accumulating variants) (Fig. 6)
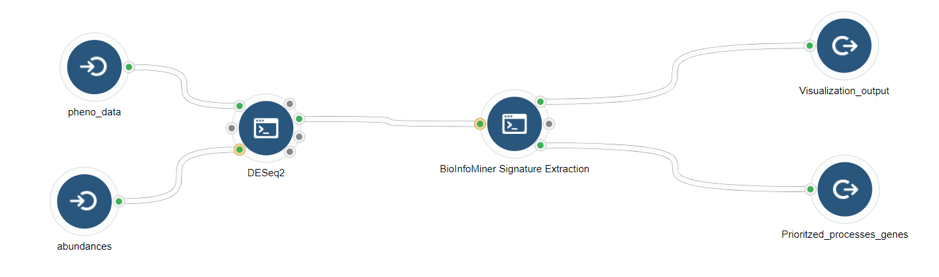
- RNA-Seq (differentially expressed genes) (Fig. 7)
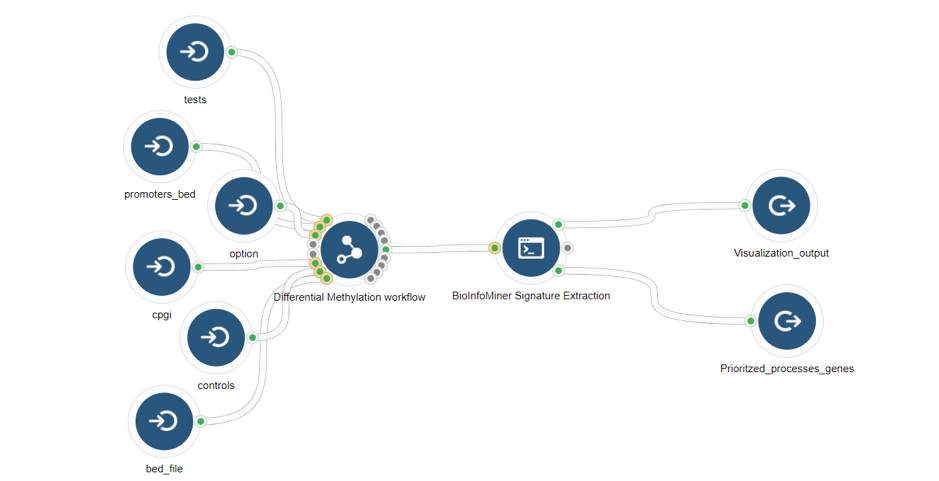
- Whole Genome Bisulfite Sequencing (differentially methylated genes) (Fig .8)
Case Studies
Users can extract raw data from NGS experiments on cancer samples from the TCGA dataset, directly on the Cancer Genomics Cloud (CGC) and then further analyze them in a single workflow, including all steps from raw data analysis to interpretation and biomarker signature derivation, through the BioInfoMiner Signature Extraction module.
Access of TCGA data using Cancer Genomics Cloud
The CGC, powered by Seven Bridges, is a pilot project funded by the National Cancer Institute (NCI) to store large genomics datasets and computational resources in the cloud. CGC hosts petabytes of TCGA data alongside hundreds of bioinformatic tools and gives on-demand access to thousands of CPU cores for analysis. Seven Bridges created a unified metadata ontology from cancer studies and provided computing infrastructure to facilitate customized analyses on the CGC.
Case Study 1: Derivation of a Biomarker Signature and Validation Through Survival Analysis, using TCGA Data on the CGC Platform
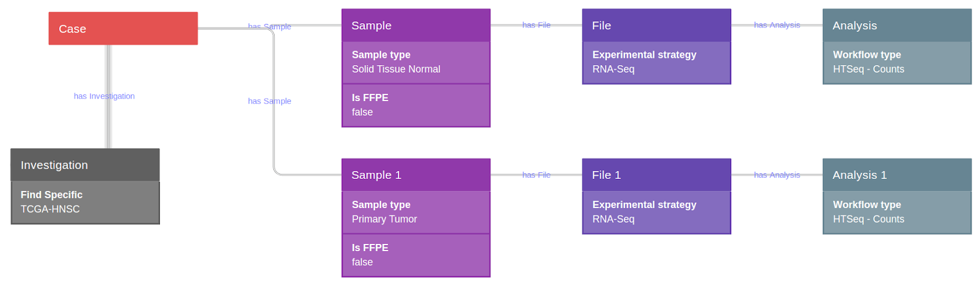
1) Data extraction from TCGA through the CGC
Using CGC tools, a query was constructed for the selection of the total
available TCGA head neck squamous cell carcinoma (TCGA-HNSC GRCh38) dataset,
which comprised raw HTSeq counts (nonnormalized, integer-only counts of
reads/fragments uniquely mapping to genes) of the 43 paired primary tumor and
solid tissue normal sample (non-formalin fixed paraffin embedded samples-FFPE)
(Fig. 9).
2) Analysis workflow from raw data to differentially expressed genes
The raw files were used as input to a CGC workflow comprising three main steps: pre-processing, normalization and differential expression analysis. A total of 940 differentially expressed genes in tumors were identified by comparison to non‑tumor adjacent tissue expression (thresholds: |log2-fold change| > 1.5 & FDR value < 0.01).
3) Signature extraction with the BioInfoMiner app on the Seven Bridges platform
The differentially expressed genes along with their respective p-values and fold change ratios were used as input to the BioInfoMiner app, in order to identify the most important biological processes implicated in head neck cancer progression and pathophysiology, as well as to prioritize genes with a central role in the specific disease. The derived signature, consisting of 26 prioritized genes, is shown in Fig. 10.
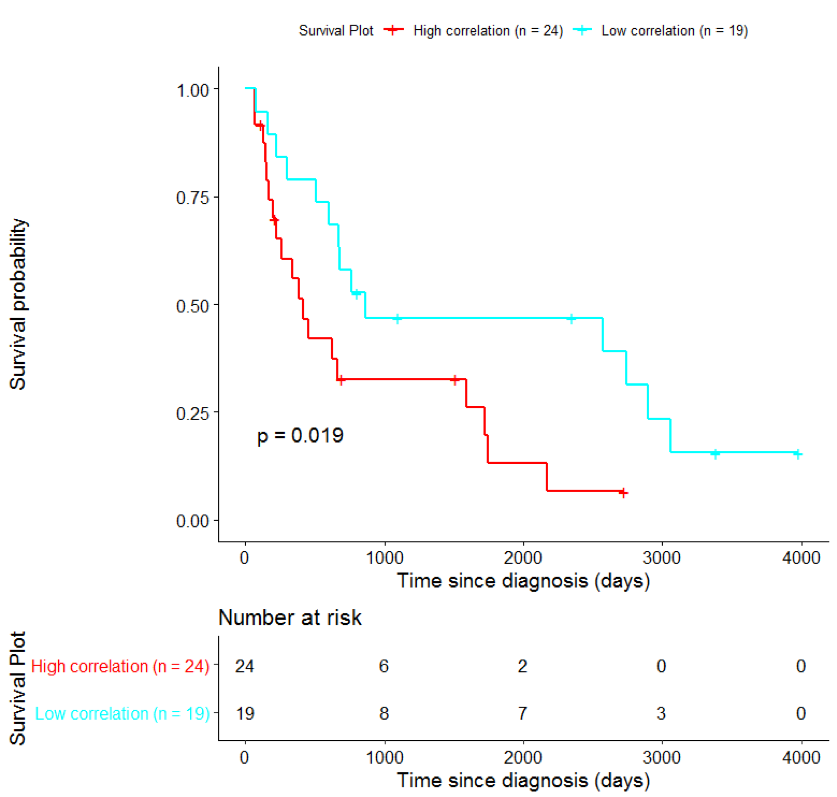
4) Validation of the signature with survival analysis using available patient data
Kaplan-Meier survival analysis is commonly used in order to assess the effect of an intervention (e.g. treatment with a drug) by measuring the number of subjects survived over a period of time.
In order to assess the importance of the signature-derived genes as potential drug targets, survival analysis was performed using available patients’ data of the TCGA-HNSC dataset, retrieved from CGC. Patients were separated into two groups (high/low correlation), based on the correlation of their gene expression profile to the extracted BioInfoMiner signature. The Kaplan-Meier survival curve is defined as the probability of surviving in a given length of time while considering time in many small intervals. As shown in Fig. 11, the two groups had significantly different survival profiles (p-value: 0.019) suggesting that a potential treatment with drugs targeting the prioritized genes, would significantly affect the investigated phenotype.
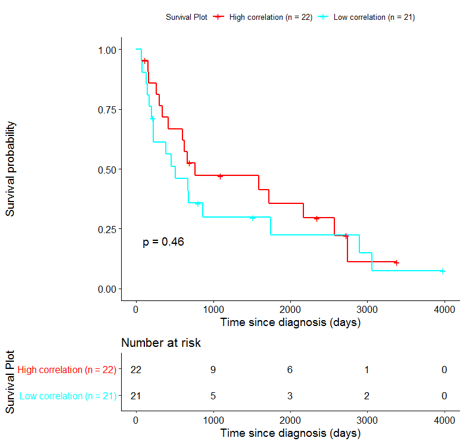
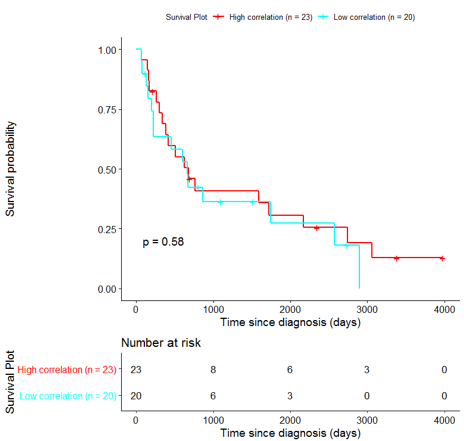
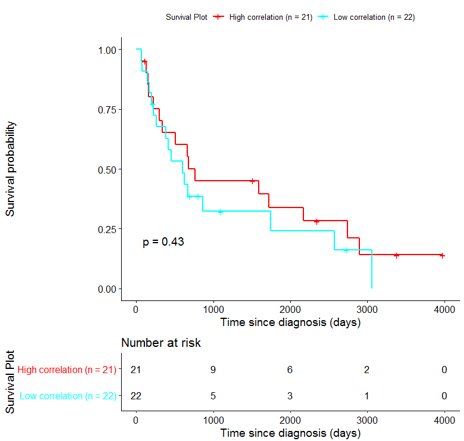
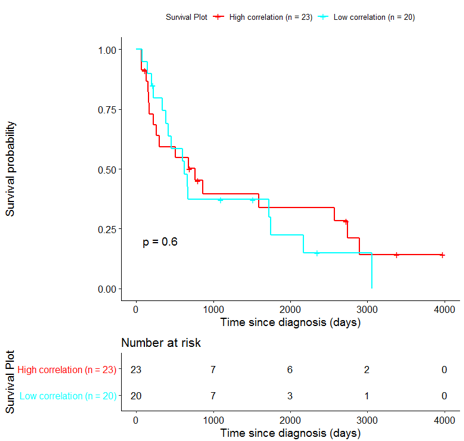
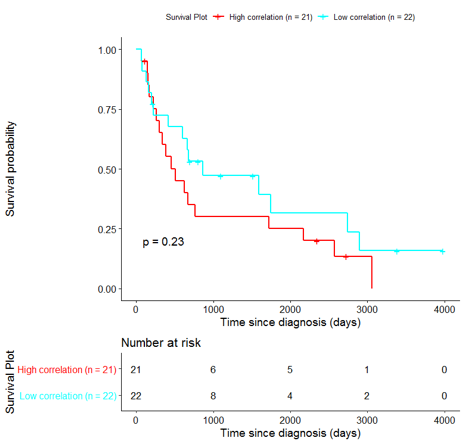
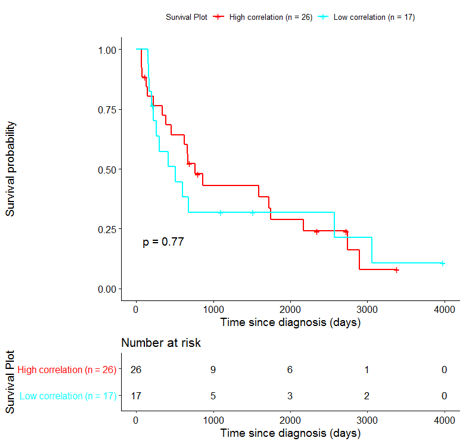
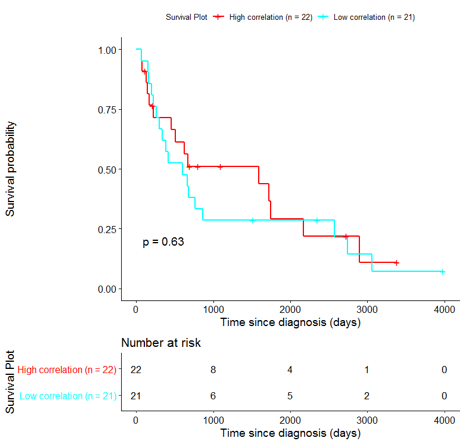
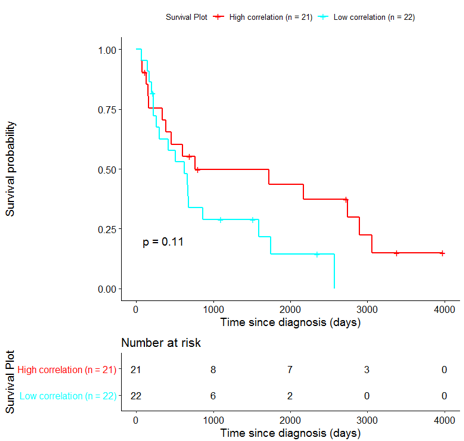
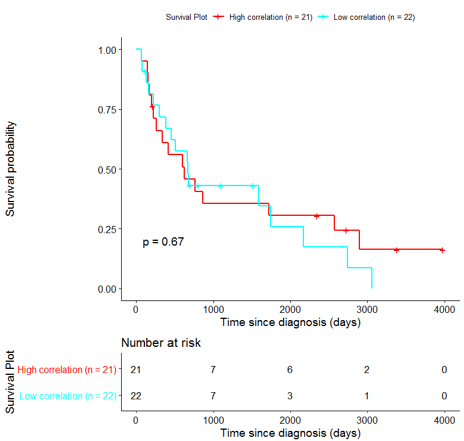
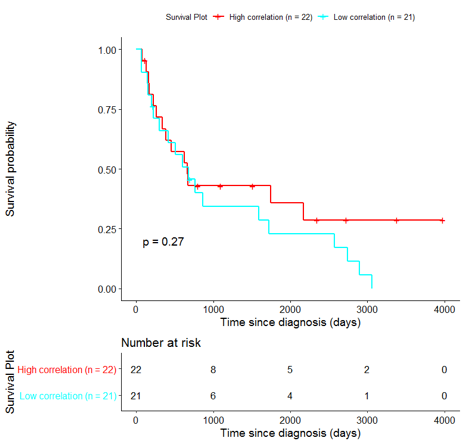
The same analysis was additionally performed using 10 randomly selected sets of 26 genes, among the 940 differentially expressed genes. The resulting survival curves (Fig. 12) show that no significant difference was found using any of the random 26-gene sets, confirming the potential clinical validity of the BioInfoMiner signature.
 |  |
 |  |
 |  |
 |  |
 |  |
Case Study 2: Pharmacogenomic Analysis on CGC using a BioInfoMiner Signature Derived from TCGA-Breast Cancer Data
1) Data extraction from TCGA through CGC
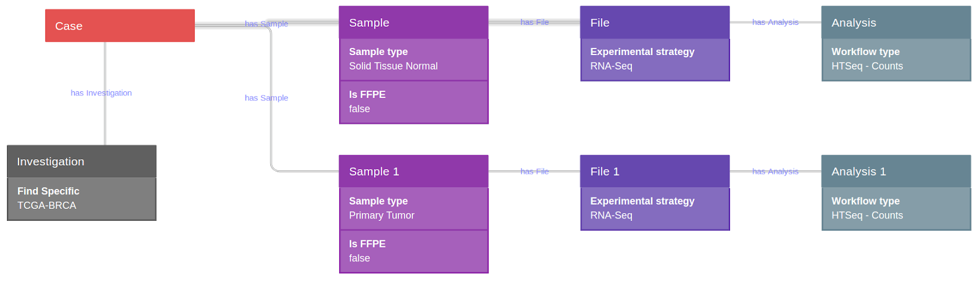
Data were selected and retrieved from CGC. Using CGC tools, a query was constructed for the selection of a TCGA breast invasive adenocarcinoma (TCGA-BRCA GRCh38) dataset, which comprised raw HTseq counts (nonnormalized integer-only counts of reads/fragments uniquely mapping to genes) of 105 primary tumor samples, and 105 solid tissue normal samples (non-formalin fixed paraffin embedded samples-FFPE) (Fig. 1).
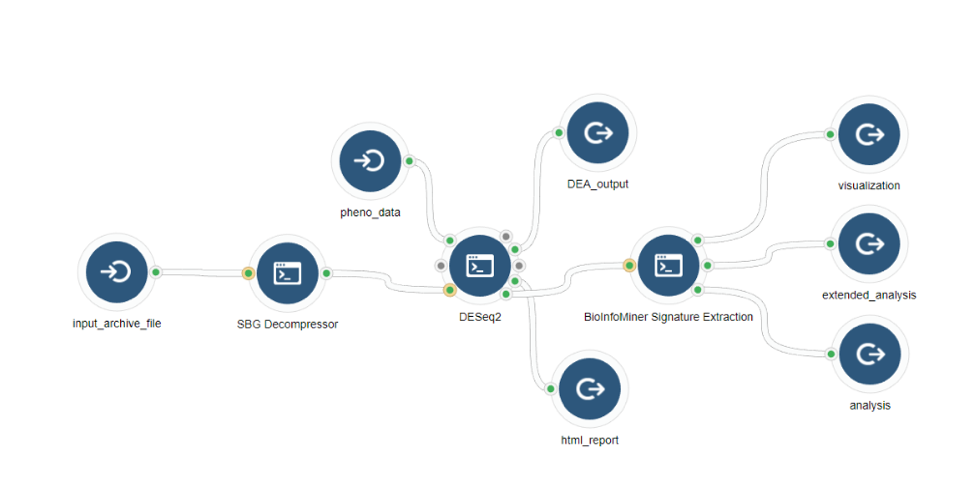
2) Workflow for analysis from raw data to differentially expressed genes
The selected sample raw files were used as the input of an analysis workflow on the CGC platform comprising three main steps: pre-processing, normalization and differential expression analysis (Fig. 13). The differentially expressed genes were identified by comparison to non‑tumor tissue expression, resulting in 968 differentially expressed genes (thresholds: |log2-fold change| > 1.5 & FDR value <0.01).
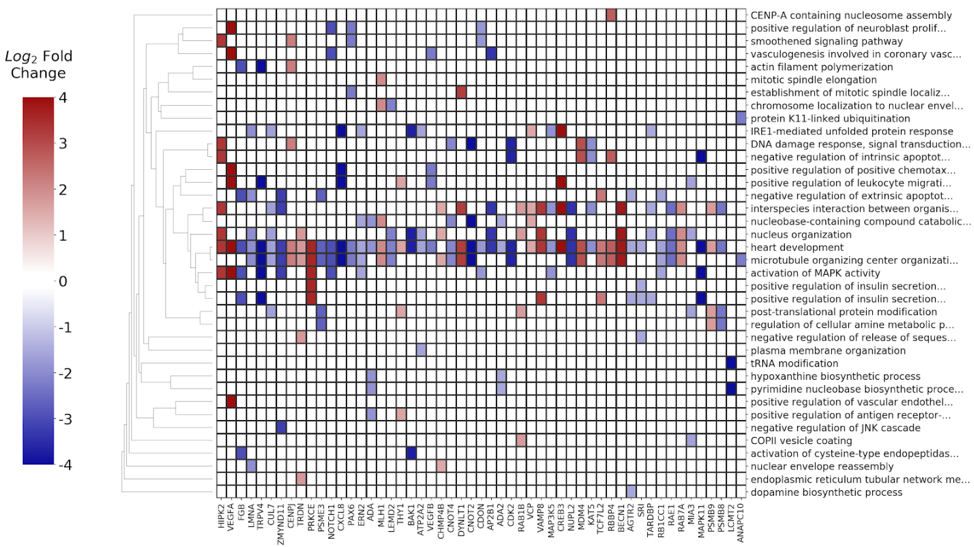
3) Signature extraction with the BioInfoMiner app on the Seven Bridges platform
The differentially expressed genes along with their respective p-values and fold change values were used as input to the BioInfoMiner app, in order to identify the most important biological processes implicated in breast cancer progression and pathophysiology, as well as to prioritize genes with a central role in the specific disease. The derived signature, consisting of 53 prioritized genes, is shown in Fig. 15.
4) Pharmacogenomic evaluation of prioritized genes
The derived signature was evaluated based on annotations of prioritized genes in pharmacogenomic databases (DrugBank, PharmaGKB) as well as in literature. A total of 24 out of the 53 genes were either already established as drug targets or suggested in literature as potential biomarkers for breast cancer or other cancers (Table 1).
No. |
GENE (Rank) |
RELATED DRUG |
DESCRIPTION |
SOURCE |
|
1 |
HIPK2 (1) |
VADIMEZAN targets HIPK2 |
In non-small cell lung cancer vadimezan combined with chemotherapy extents survival for five months. Vadimezan is suggested as a potential treatment for HER2-negative metastatic breast cancer. |
DrugBank |
|
HIPK2 inactivation increases tumorigenicity/ activation promotes apoptosis, inhibits angiogenesis, prevents tumor metastasis and attenuation of multidrug resistance. |
[1] |
||||
2 |
VEGFA (2) |
BEVACIZUMAB targets VEGFA |
VEGFA polymorphisms affect clinical outcome following bevacizumab treatment in metastatic breast neoplasms |
PharmaGKB |
|
IRINOTECAN targets VEGFA |
Irinotecan is used for the treatment of metastatic colorectal cancer and is combined with cisplatin for the treatment of small cell lung cancer. |
Drugbank |
|||
Cancer related gene. |
Human Protein Atlas |
||||
Upregulated in many known tumors correlated with tumor stage and progression. |
Human Protein Atlas |
||||
3 |
LMNA (4) |
Downregulated in breast cancer, associated with decreased overall survival and increase of metastatic sites number, tumor aggressiveness, disease recurrence. |
[2] |
||
Cancer related gene. |
Human Protein Atlas |
||||
4 |
TRPV4 (5) |
Pharmacological activation of TRPV4 promotes cell death via oncosis and apoptosis in breast cancer cells, overexpression suppresses tumor cell growth in vivo. |
[3] |
||
5 |
ZMYND11 (7) |
Acts as a tumor-suppressor. |
[4] |
||
6 |
PRKCE (10) |
PKCE overexpression is associated with the development of a malignant and metastatic phenotype, with high histological grade, positive ErbB2/Her2 status |
[5] |
||
Cancer related gene. |
Human Protein Atlas |
||||
7 |
NOTCH1 (12) |
Notch-1-PTEN-ERK1/2 signaling axis promotes HER2+ breast cancer cell proliferation and stem cell survival |
|||
Cancer related gene. |
Human Protein Atlas |
||||
8 |
CXCL8 (13) |
CXCL8 is suggested as a prognostic cancer biomarker and a potential therapeutic target for cancer treatment. |
[6] |
||
Cancer related gene |
Human Protein Atlas |
||||
9 |
ADA (16) |
PENTOSTATIN inhibitor of ADA |
The drug is effective in the treatment of hairy-cell leukemia. |
DrugBank |
|
DIPYRIDAMOLE |
Blocks uptake and metabolism of adenosine by erythrocytes and vascular endothelial cells. |
DrugBank |
|||
10 |
BAK1 (20) |
Acts as a biomarker and favorable prognostic factor for Taxol treatment in breast cancer. |
[7] |
||
11 |
VEGFB (22) |
Cancer related gene. |
Human Protein Atlas |
||
12 |
CNOT2 (24) |
Potential molecular target for breast cancer treatment. |
[8] |
||
13 |
CDON (27) |
Prognostic, high expression is favorable in breast cancer. |
Human Protein Atlas |
||
14 |
ADA2 (29) |
ADA2 differential diagnosis of benign and malignant breast disease. |
[9] |
||
Suggested therapeutic target for breast cancer. |
[10] |
||||
15 |
VCP (32) |
Suggested prognostic biomarker in breast carcinoma. |
[11] |
||
Novel therapeutic target in cancer cells, especially for secretory phenotype. |
[12] |
||||
16 |
VAMP8 (33) |
Potential surrogate marker for survival in breast cancer. |
[13] |
||
17 |
MDM4 (37) |
DOCETAXEL and EPIRUBICIN |
Polymorphisms in MDM4 associated with increased response to docetaxel and epirubicin in women with breast neoplasms. |
PharmaGKB |
|
Indications for promoting Triple Negative Breast Cancer metastasis. |
[14] |
||||
Cancer related gene. |
Human Protein Atlas |
||||
18 |
KAT5 (38) |
Biomarker for breast cancer patients’ stratification. Low expression is correlated with breast cancer recurrence. |
[15] |
||
Downregulation of KAT5 and high levels of miR-22 are associated with poor overall survival in breast cancer. |
[16] |
||||
19 |
BECN1 (41) |
Identified as an oncogene, providing a novel potential target for the treatment of Triple Negative Breast Cancer (TNBC). |
[17] |
||
20 |
SRI (43) |
Overexpression of SRI is associated with breast cancer. |
[18] |
||
21 |
TARDBP (44) |
Clinical data demonstrate that TDP43 is highly expressed in TNBC with poor prognosis. |
[19] |
||
22 |
RAE1 (46) |
Its overexpression leads to aggressive breast cancer phenotypes. Potential therapeutic target. |
[20] |
||
Possible prognostic marker and therapeutic target in malignant breast cancers. |
[21] |
||||
24 |
MAPK11 (49) |
REGORAFENIB inhibitor of MAPK11 |
Treatment of metastatic colorectal cancer, advanced gastrointestinal stromal tumours, and hepatocellular carcinoma. |
DrugBank |
|
24 |
ANAPC10 (53) |
Suggested therapeutic target in TNBC. |
[22] |
References
- Feng, Y., et al., Homeodomain-interacting protein kinase 2 (HIPK2): a promising target for anti-cancer therapies. Oncotarget, 2017. 8(12): p. 20452-20461.
- Guinde, J., et al., Lamins in Lung Cancer: Biomarkers and Key Factors for Disease Progression through miR-9 Regulation? Cells, 2018. 7(7).
- Peters, A.A., et al., Oncosis and apoptosis induction by activation of an overexpressed ion channel in breast cancer cells. Oncogene, 2017. 36(46): p. 6490-6500.
- Wen, H., et al., ZMYND11 links histone H3.3K36me3 to transcription elongation and tumour suppression. Nature, 2014. 508(7495): p. 263-8.
- Wang, H., et al., Transcriptional regulation of oncogenic protein kinase C (PKC) by STAT1 and Sp1 proteins. J Biol Chem, 2014. 289(28): p. 19823-38.
- Todorovic-Rakovic, N. and J. Milovanovic, Interleukin-8 in breast cancer progression. J Interferon Cytokine Res, 2013. 33(10): p. 563-70.
- Luo, Y., et al., High Bak Expression Is Associated with a Favorable Prognosis in Breast Cancer and Sensitizes Breast Cancer Cells to Paclitaxel. PLoS One, 2015. 10(9): p. e0138955.
- Sohn, E.J., et al., CNOT2 promotes proliferation and angiogenesis via VEGF signaling in MDA-MB-231 breast cancer cells. Cancer Lett, 2018. 412: p. 88-98.
- Aghaei, M., et al., Diagnostic value of adenosine deaminase activity in benign and malignant breast tumors. Arch Med Res, 2010. 41(1): p. 14-8.
- Kutryb-Zajac, B., et al., Adenosine deaminase inhibition suppresses progression of 4T1 murine breast cancer by adenosine receptor-dependent mechanisms. J Cell Mol Med, 2018. 22(12): p. 5939-5954.
- Cui, Y., et al., High expression of valosin-containing protein predicts poor prognosis in patients with breast carcinoma. Tumour Biol, 2015. 36(12): p. 9919-27.
- Vekaria, P.H., et al., Targeting p97 to Disrupt Protein Homeostasis in Cancer. Front Oncol, 2016. 6: p. 181.
- Yuan, M., et al., Significance of Vesicle-Associated Membrane Protein 8 Expression in Predicting Survival in Breast Cancer. J Breast Cancer, 2018. 21(4): p. 399-405.
- Gao, C., et al., Context-dependent roles of MDMX (MDM4) and MDM2 in breast cancer proliferation and circulating tumor cells. Breast Cancer Res, 2019. 21(1): p. 5.
- McGuire, A., et al., Quantifying Tip60 (Kat5) stratifies breast cancer. Sci Rep, 2019. 9(1): p. 3819.
- Pandey, A.K., et al., TIP60-miR-22 axis as a prognostic marker of breast cancer progression. Oncotarget, 2015. 6(38): p. 41290-306.
- Wu, C.L., et al., BECN1-knockout impairs tumor growth, migration and invasion by suppressing the cell cycle and partially suppressing the epithelial-mesenchymal transition of human triple-negative breast cancer cells. Int J Oncol, 2018. 53(3): p. 1301-1312.
- Shabnam, B., et al., Sorcin a Potential Molecular Target for Cancer Therapy. Transl Oncol, 2018. 11(6): p. 1379-1389.
- Ke, H., et al., Loss of TDP43 inhibits progression of triple-negative breast cancer in coordination with SRSF3. Proc Natl Acad Sci U S A, 2018. 115(15): p. E3426-E3435.
- Oh, J.H., et al., RAE1 mediated ZEB1 expression promotes epithelial-mesenchymal transition in breast cancer. Sci Rep, 2019. 9(1): p. 2977.
- Oh, J.H., et al., The mitotic checkpoint regulator RAE1 induces aggressive breast cancer cell phenotypes by mediating epithelial-mesenchymal transition. Sci Rep, 2017. 7: p. 42256.
- Thu, K.L., et al., Disruption of the anaphase-promoting complex confers resistance to TTK inhibitors in triple-negative breast cancer. Proc Natl Acad Sci U S A, 2018. 115(7): p. E1570-E1577.