Accurate Analysis of Differential Methylation Data
With few exceptions, every human cell is composed of an identical DNA sequence. However, there are around 200 different cell types in our bodies. What is the underlying reason? Each different cell type represents a specific gene expression pattern. One of the main mechanisms that enables this is epigenetics. Epigenetics refers to the modification of DNA (or proteins associated with it) by the addition of an epigenetic mark. This can cause genes to be switched on or off without any change to the original, underlying DNA sequence.
DNA methylation is one of the most intensely studied epigenetic modifications in cancer. Although it is tightly regulated, the mechanism of DNA methylation can be error-prone. A glitch in DNA methylation can activate genes that should stay dormant, e.g. tumor oncogenes, or silence genes that should be active, e.g. tumor suppressors, thus leading to carcinogenesis. These pathological epigenetic changes create tumor-specific methylation patterns that can be used in clinical practice for the advancement of personalized medicine.
Currently, next generation sequencing (NGS) analysis is widely used in the epigenetics field. Compared to previous methods used for the analysis of epigenetic modifications (e.g. PCR or methylation arrays), NGS allows simultaneous analysis of the methylation status of large genomic regions at a single-base resolution. However, DNA methylation analysis using NGS is computationally intensive. Furthermore, there is currently no consensus on the best practice for differential methylation data analysis in the community. In order to help researchers analyse differential methylation data accurately and efficiently using cloud compute resources, Seven Bridges has developed a novel, optimized workflow for the analysis of NGS methylation data. The method is primarily focused on determining the degree of differentially methylated regions of interest across the genome, between the desired test and control group, e.g. promoter regions or CpG islands.
Together with the Bismark Analysis workflow, which can be used for processing bisulfite sequencing reads (FASTQ files), our Differential methylation workflow enables complete analysis, from raw bisulfite sequencing data to visualized and statistically processed results of differentially methylated genes. A schematic representation of the analysis is depicted in Figure 1.
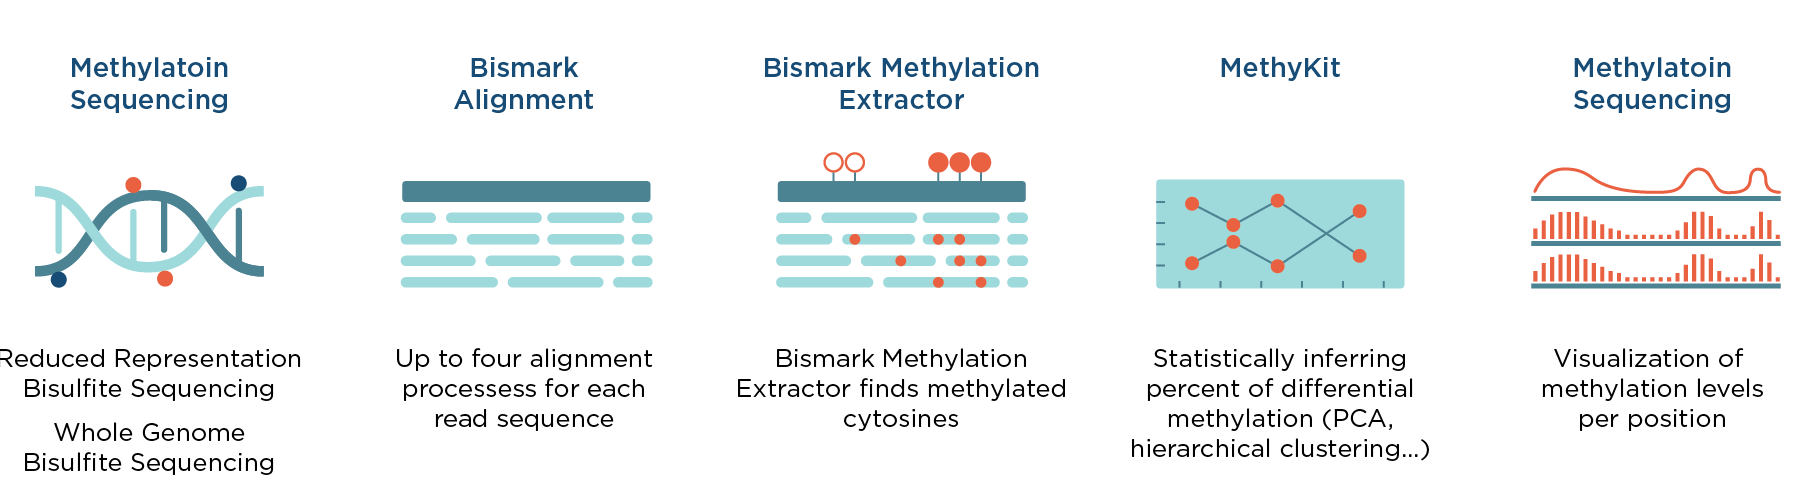
Differential methylation workflow starts with a Coverage file, which can be generated by processing bisulfite sequencing reads (FASTQ files) with the Bismark Analysis workflow, which is available in the Seven Bridges Public Apps gallery. It is based on MethylKit R package and the custom Seven Bridges Visualization Coverage File Tool. This tool facilitates visual comparison of methylation levels for desired regions and the workflow is optimized to process multiple samples in parallel (eg. tumor and normal, either technical or biological replicates, different tissues, etc.)
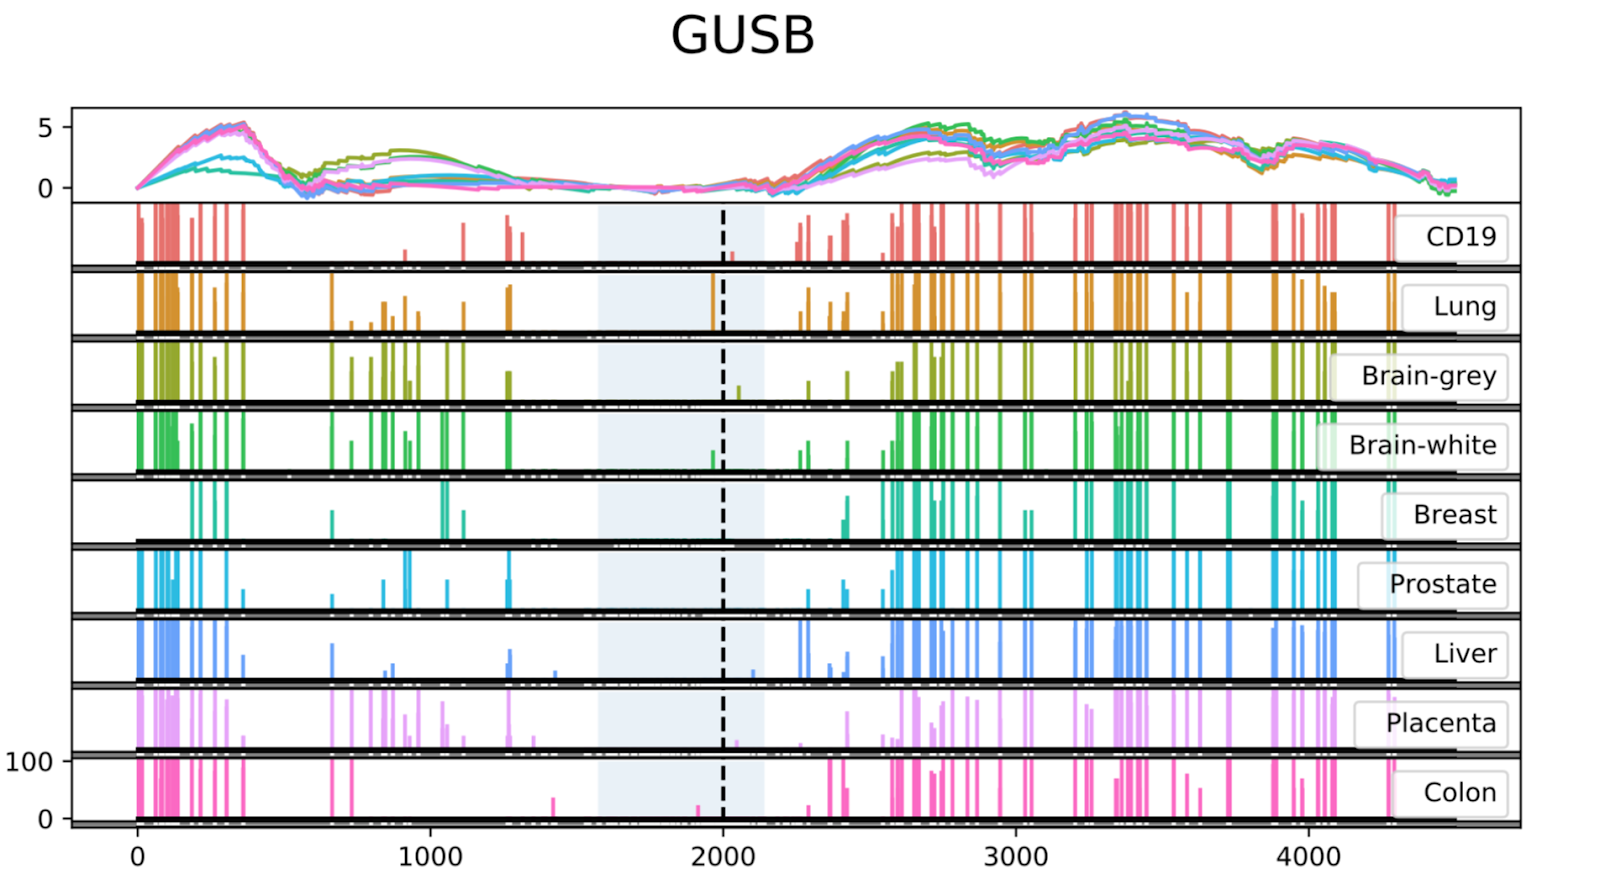
An example of an output file represented by the Seven Bridges Visualization Coverage Tool is depicted in Figure 2. The analysis has been reproduced from the study by Vidal et al and the data shows low methylation levels at a CpG Island in the promoter region of the housekeeping gene GUSB across different tissues1.
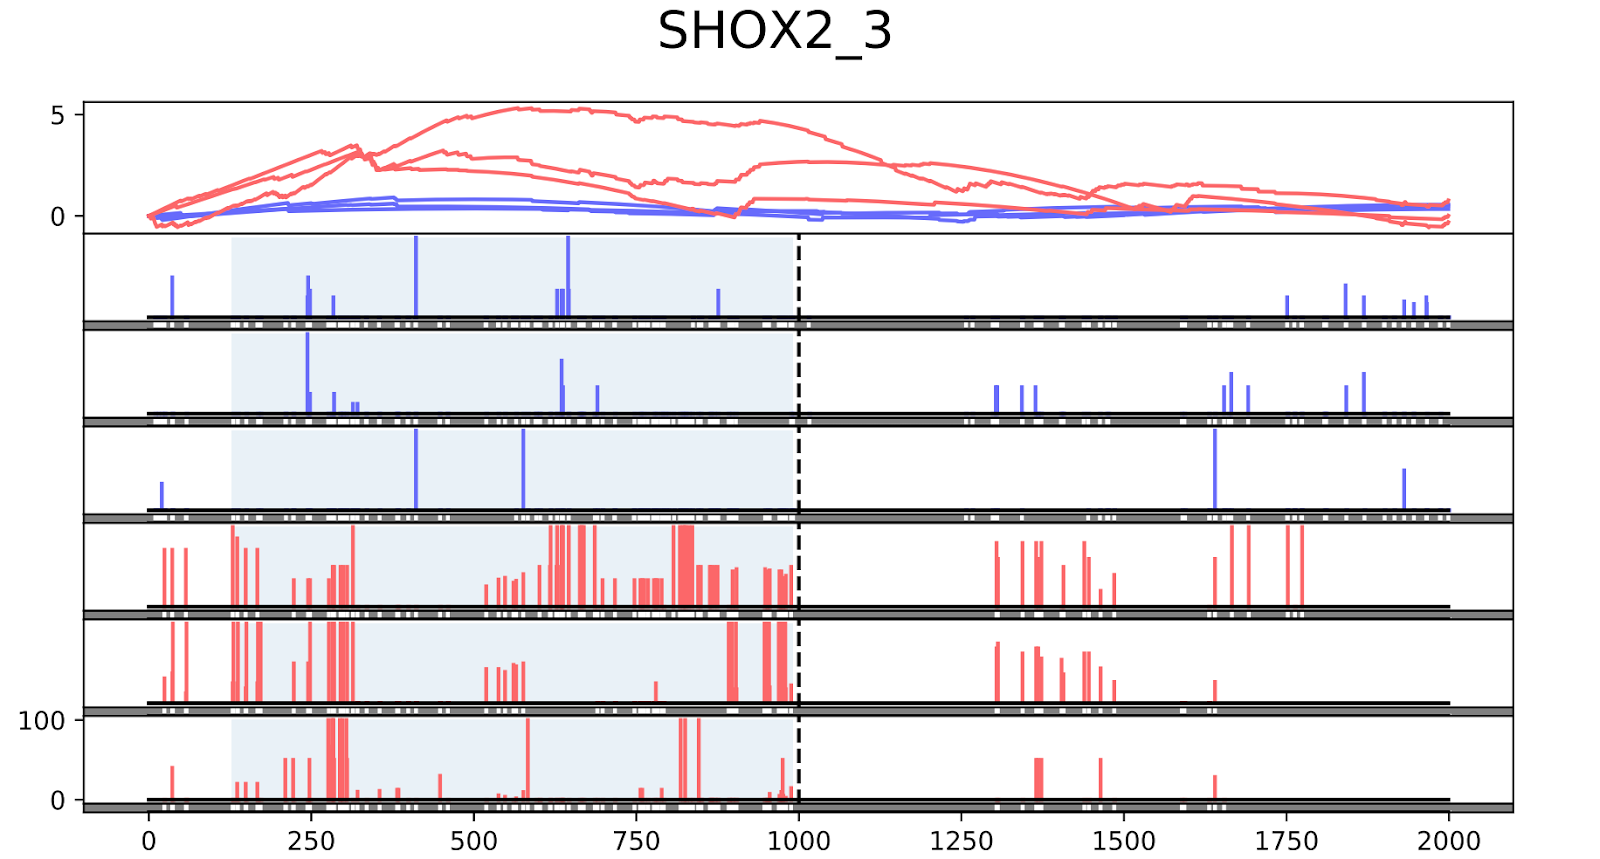
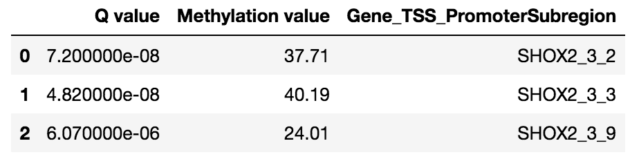
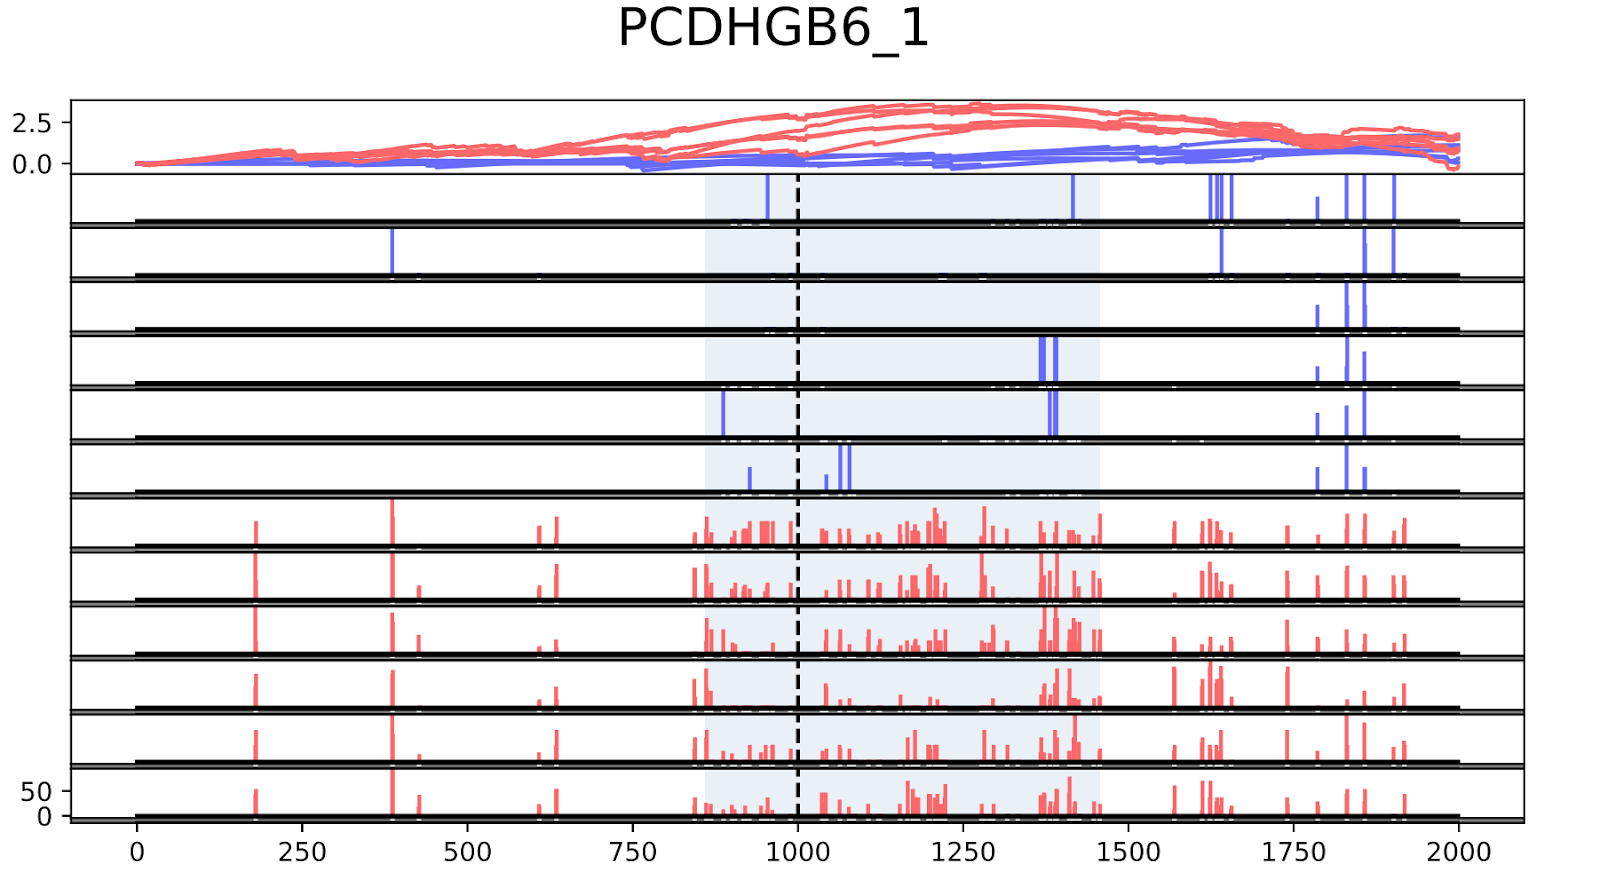
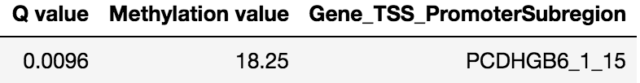
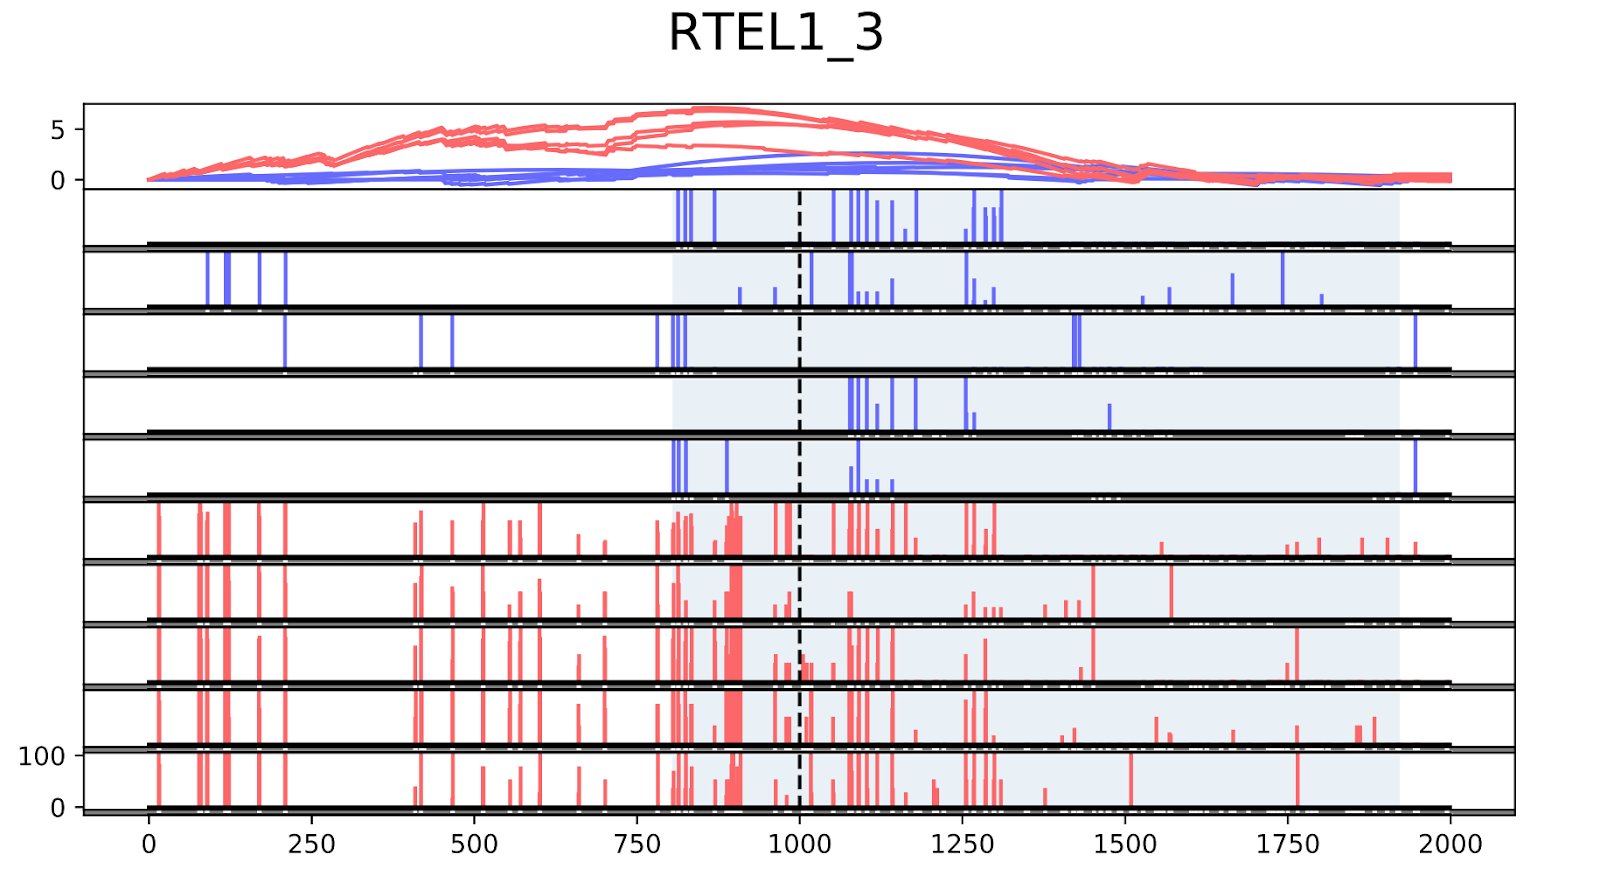
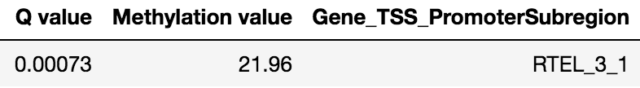
To validate the workflow, we used existing validated tumor markers from studies by Guo et al. and Kang et al as a reference2,3. For this analysis, we focused on the hypermethylated promoter regions of tumor suppressor genes related to specific cancer types using samples. SHOX2 was particularly interesting because its methylated promoter is currently used as a diagnostic marker from liquid biopsy for lung cancer detection. Figure 3 shows the methylation pattern of SHOX2 in normal and lung cancer tissues. We confirmed hypermethylation of the SHOX2 promoter in tumor tissue samples, in agreement with a previous study by Zhao et al 4. RTEL1 and PCDHGB6 were proposed as tumor markers that should be analysed simultaneously as a method to diagnose lung cancer using liquid biopsy in a non-invasive manner5. Figures 4 and 5 show the methylation patterns of PCDHGB6 and RTEL1 in plasma samples, respectively. Tables 1, 2 and 3 represent results obtained from MethylKit’s statistical analysis for SHOX2, PCDHGB6 and RTEL1, respectively. For the purposes of simplified illustration, the plotted samples represent only a subset of the tested samples.
Below are the challenges that one may encounter while analysing methylation data, together with possible approaches to overcome them.
- Challenge: The exact position of the promoters is still unknown for the majority of genes.
- Possible solution: We used the Eukaryotic promoter database as a source of experimentally validated transcription start sites (TSS), and defined a promoter of a certain gene as a region starting 1000bp upstream of a gene TSS and ending 1000bp downstream. These regions can be adjusted depending on the analysis.
- Challenge: The exact position of the transcription factor binding site (TFBS) in promoters is still difficult to predict. In addition, the exact changes in methylation levels inside the TFBS that are sufficient to alter gene expression are still unspecified.
- Possible solution: In order to bypass these obstacles and to advance the analysis, we decided to split promoter regions into smaller subregions. Those subregions were subjected to differential methylation analysis in order to have better insight into methylation levels variation within promoter regions.
The Seven Bridges Platform now offers a solution for complete analysis of methylation NGS data starting from optimized Bismark alignment. Our analysis determines differential methylation levels with MethylKit and visualizes statistically significant results. Importantly, we have validated our initial results as demonstrated by the detection of similar methylation patterns between solid tissue and plasma samples with established tumor markers for lung and colon cancer. Hence, methylation pattern analysis is promising and may potentially become broadly applicable in the field of personalized medicine through cancer diagnostics. In addition, there is also the potential of discovering novel tumor markers through this analysis.
References:
- Vidal, E., Sayols, S., Moran, S., Guillaumet-Adkins, A., Schroeder, M. P., Royo, R., & Heyn, H. A DNA methylation map of human cancer at single base-pair resolution. Oncogene, 2017;36(40), 5648-5657.
- Guo, S., Diep, D., Plongthongkum, N., Fung, H. L., Zhang, K., & Zhang, K. Identification of methylation haplotype blocks aids in deconvolution of heterogeneous tissue samples and tumor tissue-of-origin mapping from plasma DNA. Nature Genetics, 2017;49(4), 635.
- Kang, S., Li, Q., Chen, Q., Zhou, Y., Park, S., Lee, G., & Alber, F. CancerLocator: non-invasive cancer diagnosis and tissue-of-origin prediction using methylation profiles of cell-free DNA. Genome Biology, 2017;18(1), 1-12.
- Zhao, Q. T., Guo, T., Wang, H. E., Zhang, X. P., Zhang, H., Wang, Z. K., & Duan, G. C. Diagnostic value of SHOX2 DNA methylation in lung cancer: a meta-analysis. OncoTargets And Therapy, 2015;8, 3433.
- Powrózek, T., Krawczyk, P. ,Kuźnar-Kamińska, B., et al. Analysis of RTEL1 and PCDHGB6 promoter methylation in circulating-free DNA of lung cancer patients using liquid biopsy: A pilot study. Exp Lung Res 2016;42:307-13.