Single and Multiple Variant Association Testing on Seven Bridges
For researchers interested in performing genotype-phenotype association studies, Seven Bridges offers a suite of tools for both single-variant and multiple-variant association testing. These tools and features include EPACTS, PLINK, and the GENESIS pipelines.
EPACTS
EPACTS (Efficient and Parallelizable Association Container Toolbox) is a versatile software pipeline to perform various statistical tests for identifying genome-wide association from sequence data. EPACTS achieves this through a user-friendly interface, both for scientific analysts and for method developers. This toolbox was first developed by the Abecasis lab of the Department of Biostatistics at the University of Michigan. The main benefits of this toolbox are in the title: efficiency and parallelization. The benefit of the former is saving time and money, while the benefit of the latter is that analysis duration can be significantly reduced through parallelization. Users also benefit from the toolbox’s lengthy list of available statistical analyses.
EPACTS currently provides the following set of key features:
- Robust support for widely-used format of sequence-based genotypes (VCF) and phenotypes with pedigree (PED)
- Efficient library for accessing VCF file to reduce the computational burden required to analyze large-scale sequencing data
- Support for using genotype dosages instead of hard genotype calls
- Utilize PED format to perform tests across multiple traits
- Supports a large number of widely used statistical tests for single variant association and burden tests
- Easy to highly parallelize jobs
- Integrative and versatile framework that allows easy addition of additional statistical tests
- Core input/output routines are implemented in C++
- Most statistical tests (except for EMMAX) are implemented in R
- Functional annotation of associated variants and generation of QQ, Manhattan Plot and Zoom plot for the significant associations
The following functions are wrapped as individual tools in EPACTS on Seven Bridges platforms:
- EPACTS Annotate
- Used to annotate EPACTS or VCF files for further EPACTS analyses
- This tool will output an annotated VCF file, along with its corresponding index file (TBI)
- EPACTS Single Variant Test
- Used in testing for association between genetic variants and complex traits
- Tool calculates the influence (correlation, probability) for each variant in multisample (usually joint called) VCF to a certain disease
- EPACTS Zoom Plot
- Generates a Zoom plot that shows association P-values on the vertical axis, and the chromosomal position along the horizontal axis
- Gives option to plot either one association of interest or to a select number of top associations from an analysis
- To identify SNPs that may be potentially causative, Zoom plot shows the magnitude of association for each SNP and the pairwise LD pattern
- EPACTS Create Marker Group File
- Creates the GRP file containing the list of markers per group, needed for the EPACTS Groupwise Burden Test tool
- EPACTS Create Kinship Matrix
- Creates a file containing the kinship coefficients of the samples from the input multi-sample VCF
- Kinship Matrix file is needed for the EMMAX Association Analysis in the EPACTS Single Variant Test or EPACTS Groupwise Burden Test
- EPACTS Groupwise Burden Test
- Uses a weighted-sum method to jointly analyze a group of variants in order to test for group-wise association with phenotype status
- Calculates the influence (correlation, probability) for groups of variants from the multisample VCF to a certain disease
- The groups are defined in the Marker Group File
For more information on EPACTS, please see the GitHub page here, and the EPACTS Google group here.
PLINK
PLINK is a free, open-source whole genome association analysis toolset, designed to perform a range of basic, large-scale population genetics analyses in a computationally efficient manner. PLINK was initially created by Shaun Purcell whilst at the Center for Human Genetic Research, along with Massachusetts General Hospital, the Broad Institute of Harvard & MIT, among other contributors. The focus of PLINK is purely on the analysis of genotype/phenotype data. The PLINK toolset is a collection of individual tools for GWAS and for researching population genetics.
The PLINK toolset is intended to be used as one-tool/one-functionality at a time (as opposed to a workflow). To build a complete analysis, a user can utilize multiple PLINK tools, each of them having their own dedicated part of the overall analysis. Just a few of the many possible GWAS analysis performed by PLINK include input datasets QC, investigation of missingness per individual and per SNP, checking for sex discrepancy, deletion of SNPs which are not in Hardy-Weinberg equilibrium, checking the datasets for cryptic relatedness, merging different datasets, removal of problematic SNPs from the datasets, performing a MDS (MultiDimentional Scaling) analysis, performing the association analyses, etc.
The currently featured version, PLINK 1.9, offers the following functionalities:
- Data management
- Inputs filtering
- Basic statistics
- Linkage disequilibrium
- Identity-by-descent
- Association analysis
- Epistasis
For more information about PLINK, and for tutorials on its use, please see here.
GENESIS Pipelines
The GENetic EStimation and Inference in Structured samples (GENESIS) pipelines were developed by the Trans-Omics for Precision Medicine (TOPMed) Data Coordinating Center (DCC) at the University of Washington. The Seven Bridges team collaborated with the TOPMed DCC to create Common Workflow Language (CWL) tools for the GENESIS R functions, and arranged these tools into five computationally-efficient workflows (pipelines). These GENESIS pipelines offer methods for working with genotypic data obtained from sequencing and microarray analysis. Importantly, these pipelines have the robust ability to estimate and account for population and pedigree structure, which makes them ideal for performing association studies on data from the TOPMed program. These pipelines implement linear mixed models for association testing of quantitative phenotypes, and logistic mixed models for association testing of binary (e.g. case/control) phenotypes.
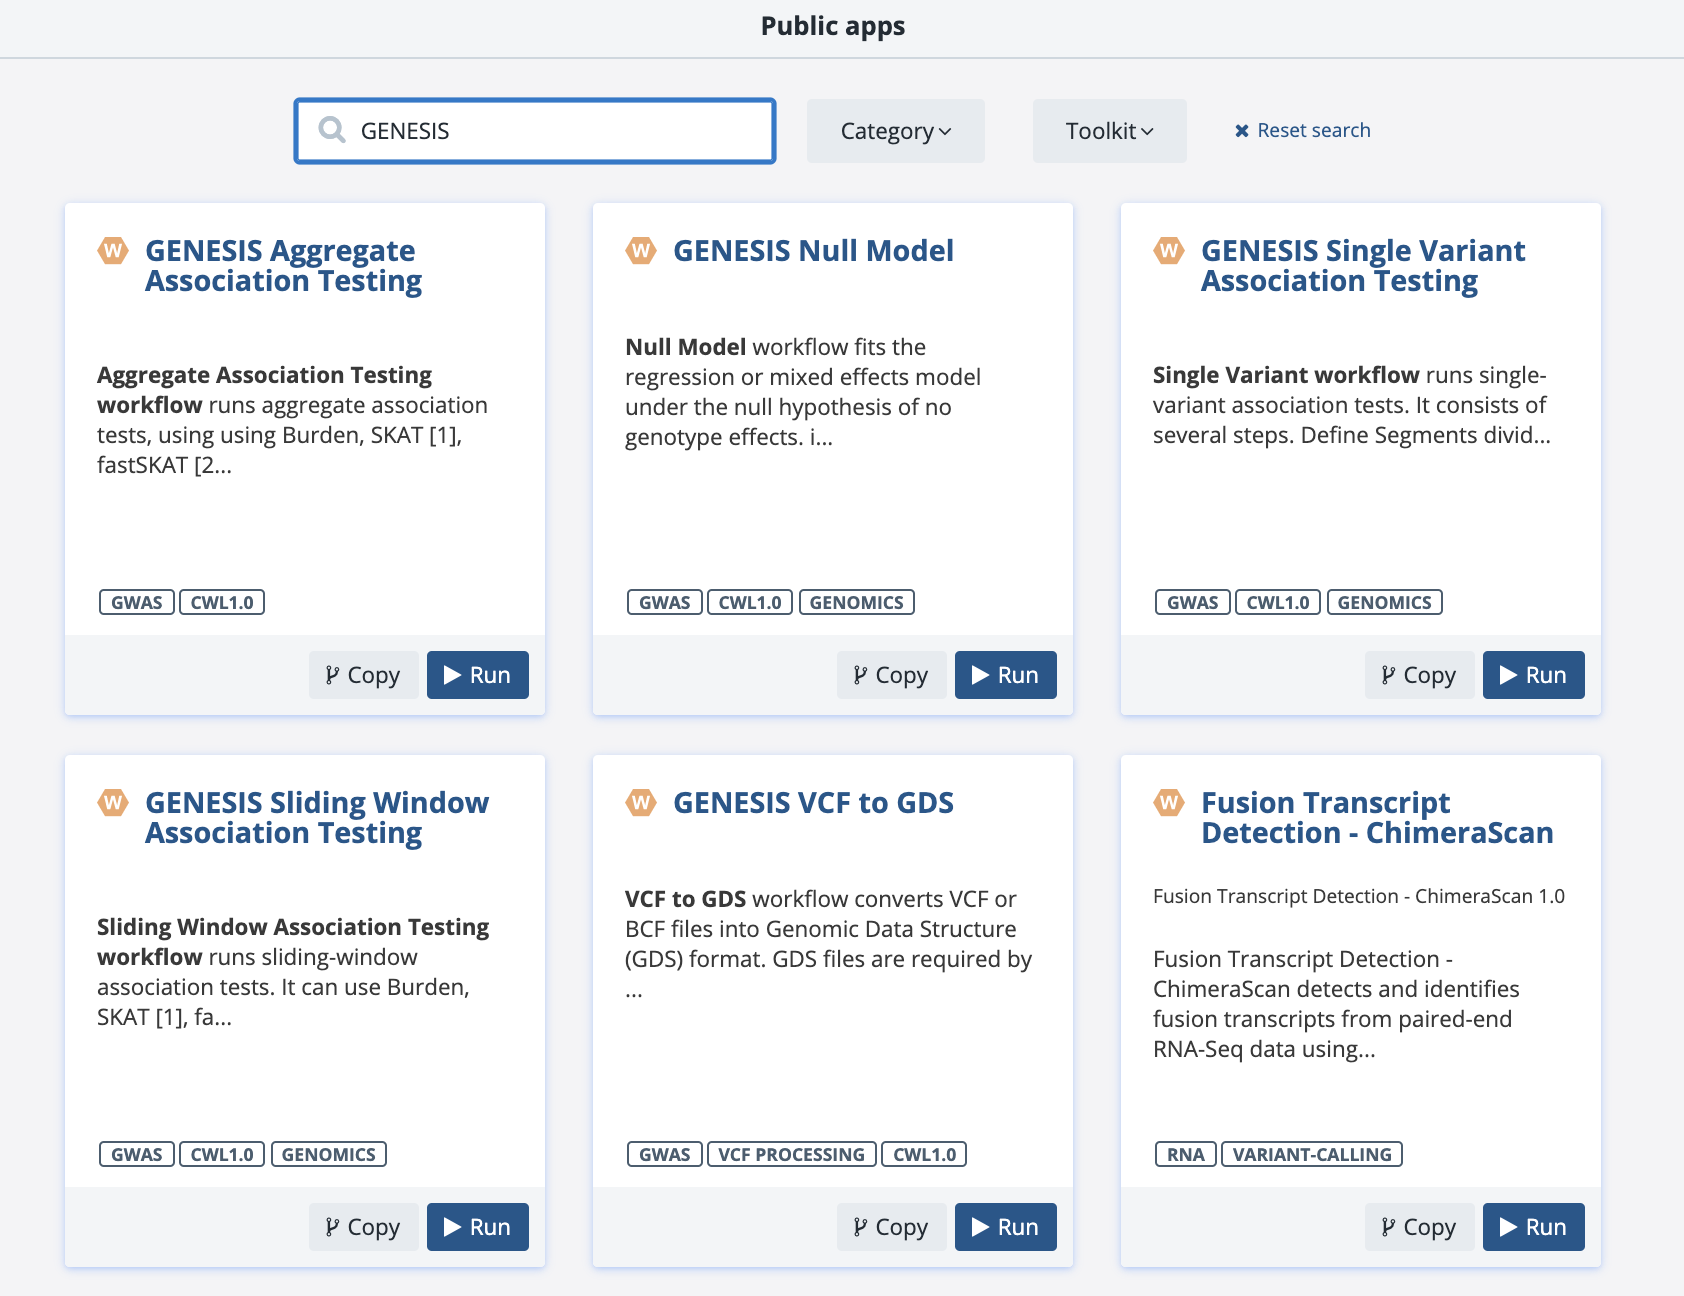
Each GENESIS pipeline has a specific utility for enabling researchers to perform various aspects of GWAS analysis:
GENESIS VCF to GDS:
This pipeline converts VCF files into Genomic Data Structure (GDS) format. GDS files are used in all of the other GENESIS pipelines described herein. The pipeline also includes a “Check GDS” step to ensure that no important information is lost during conversion. Users will only need to generate the GDS files once for a particular set of samples, and these GDS files can be used in multiple association tests with different phenotypes.
GENESIS Null Model:
The null model pipeline is the first step in performing association testing. The pipeline fits the regression or mixed effects model under the null hypothesis of no genotype effects, namely that the outcome variable is regressed on the specified fixed effect covariates and random effects. The output of this null model is then used in the subsequent association tests. The pipeline consists of two steps: The first step fits the null model, and the second step generates reports based on data, which are available both in RMD and HTML format. Individual genetic variants or groups of genetic variants can be directly tested for association with this workflow by including them as fixed effect covariates in the model (via the Conditional Variant File parameter). This would be extremely inefficient genome-wide, but is useful for follow-up analyses testing variants of interest. Additionally, this workflow can be used for trait heritability estimation.
GENESIS Single-variant Association Testing:
This pipeline runs single-variant association tests and consists of several steps: To start off, “Define Segments” divides genome into segments, either by number of segments, or by segment length. Note that the number of segments refers to the whole genome, not the number of segments per chromosome. Next, an “Association Test” step is then performed for each segment in parallel, before combining results on chromosome level. The final step produces QQ and Manhattan plots. This pipeline uses the output from a model fit using the aforementioned null model pipeline to perform score tests for all variants individually. The reported effect estimate is for the alternate allele, and multiple alternate alleles for a single variant are tested separately.
The last two pipelines are for performing multiple-variant association tests. These tests are often used when analyzing variants from whole-genome sequencing (WGS) studies since they jointly test a group of variants and can increase statistical power when using rare variants. These tests are also referred to as aggregate tests and each grouped variant set can be referred to as an aggregation unit.
GENESIS Sliding Window Association Testing:
The Sliding Window Association Testing pipeline runs multi-variant, sliding-window, association tests. It can use Burden, SKAT, fastSKAT, SMMAT, or SKAT-O to aggregate all variants in a window. This pipeline consists of similar steps as the GENESIS Single-variant Association Testing pipeline: First, “Define Segments” divides the whole genome into segments, either by number of segments or by segment length. Next, “Association Testing” is performed for each segment in parallel, before combining results on chromosome level. The final step produces QQ and Manhattan plots.
GENESIS Aggregate Association Testing:
The GENESIS Aggregate Association Testing pipeline is typically used to jointly test rare variants. This pipeline is designed to perform multi-variant association testing on user-defined groups of variants. Like the GENESIS Sliding Window pipeline, the Aggregate Association Testing pipeline runs can use Burden, SKAT, fastSKAT, SMMAT, or SKAT-O to aggregate a user-defined set of variants in order to perform aggregate association tests. The association tests are parallelized by segments within chromosomes. Like the sliding window pipeline, the first execution is “Define Segments” which splits the genome into segments and assigns each aggregate unit to a segment of the whole genome based on the position of its first variant. Second, “Association Testing” is then performed for each segment in parallel, before combining results on chromosome level. Finally, the last step creates QQ and Manhattan plots.
Benchmarking Analysis:
For all GENESIS workflows, the Seven Bridges team has performed comprehensive benchmarking analysis on Amazon Web Services (AWS) and Google Cloud Provider (GCP) instances for different scenarios, displaying the resulting execution times, costs, and more. In GENESIS Benchmarking Guide, each GENESIS workflow is described, followed by the benchmarking results and some tips for implementing that workflow from the Seven Bridges Team. Lastly, we included a Methods section to describe our approach to benchmarking and interpretation for your reference. The GENESIS Benchmarking Guide can be found here.