The Annotation Explorer: 1 billion variants, hundreds of annotations, and just a few minutes
With the ongoing proliferation of genome sequencing data, the number of rare variants found is growing rapidly. To detect associations between phenotypes of interest and these rare variants, researchers employ mechanisms to increase statistical power in association testing. Variant annotation information can be used to combine variants into biologically-relevant units of inference which can then be used in the association test. Although these methods are currently available, working with a massive volume of variants and annotation data has been a major logistical and technical obstacle for researchers.
To address this challenge, Seven Bridges features the Annotation Explorer: a tool which enables users to interactively explore, query, and study characteristics of an inventory of variant annotations. This application can be used in pre-association testing, to interactively explore aggregation and filtering strategies for variants based on annotations and generate input files for multiple-variant association testing. It can also be used in post-association testing, to explore annotations associated with a set of variants, like variant sets found significant during association testing. Annotation Explorer was developed in collaboration with the TOPMed Data Coordinating Center at the University of Washington, and currently hosts a subset of genomic annotations for variants identified in the TOPMed studies. These annotations were obtained using Whole Genome Sequence Annotator software. Using the Annotation Explorer, users can interactively aggregate and filter over 1 billion variants using hundreds of annotations at an unmatched speed: users can create queries and get back results in minutes, in contrast with traditional methods taking days to do the same.
The Annotation Explorer currently enables users to select from three databases of variants and their annotations:
- TOPMed Freeze 8
- ~1 billion variants from TOPMed studies included in Freeze8
- 450 annotation fields
- Total size: 5.8Tb
- TOPMed Freeze5
- ~ 0.6 billion variants from TOPMed studies included in Freeze5
- 150 annotation fields
- Total size: 1.7Tb
- TOPMed Freeze5-dbSNP
- ~0.46 billion variants from TOPMed Freeze5 that have been released in dbSNP, a public-domain archive for human variants
- 150 annotation fields
- Total size: 1Tb
Currently, the TOPMed Freeze8 and TOPMed Freeze5 databases are considered controlled-access. In order to work with these databases, users will need Database of Genotypes and Phenotypes (dbGaP) access to at least one TOPMed study from either of these databases. The TOPMed Freeze5-dnSNP database is open-access and does not require dbGaP approval. The ability to browse these TOPMed datasets via the Annotation Explorer is currently only available on the NHLBI BioData Catalyst platform.
The power to group variant data by annotations combined with user-friendly interactive analysis
Annotation Explorer is the first tool available to allow users to group variant data by their annotations. This allows for the incorporation of annotation data into a rare variant analysis, deepening our understanding of their role in human disease. With the Annotation Explorer, variant grouping files can be created from the results and then exported to a workspace for use in rare variant association testing. Additionally, the Annotation Explorer’s tools for interactive analysis are also powerful assets for busy researchers. Typically, setting up interactive analysis for datasets with annotation variant data requires a high level of coding proficiency in order to interact with the massive datasets in an increasingly interdisciplinary field. Even more coding expertise and effort are required to make navigating this process user-friendly. Instead, with the Annotation Explorer taking care of the coding burden, users without advanced programming knowledge can leverage the power of interactive analysis right away.
Getting oriented with the help of the Dataset Info tab
The Dataset Info tab provides users with a preview of the chosen dataset and the ability to explore different annotation fields by looking at their metadata or graphical summaries. Table Preview displays this summary information for easy data browsing. The Dataset Info tab also displays histograms and summary statistics for a selected feature as shown below:
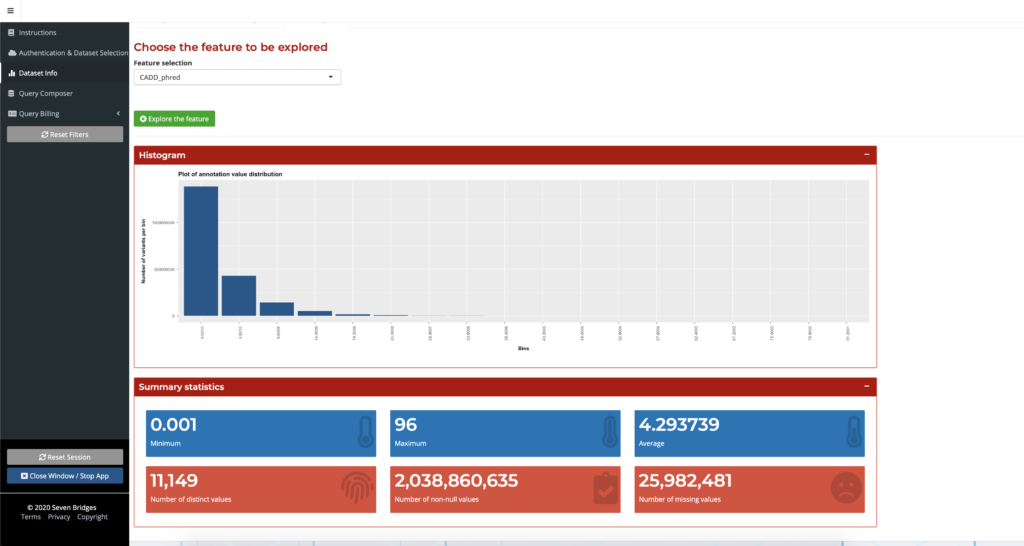
Figure 1: Feature exploration with the Dataset Info tab
At-a-glance annotation descriptions with the Metadata Explorer
With the sheer volume of data to explore, it can be difficult for a user to decide where to begin. Further complicating matters is that not all of the annotation names are self-explanatory, and the process of looking up individual definitions for these annotations can be tedious. The Metadata Explorer helps users get oriented within the dataset in order to make informed decisions about their research. Users can explore metadata such as annotation field descriptions easily by entering the annotation name to receive a description, which is especially helpful for researchers exploring new or unfamiliar annotations.
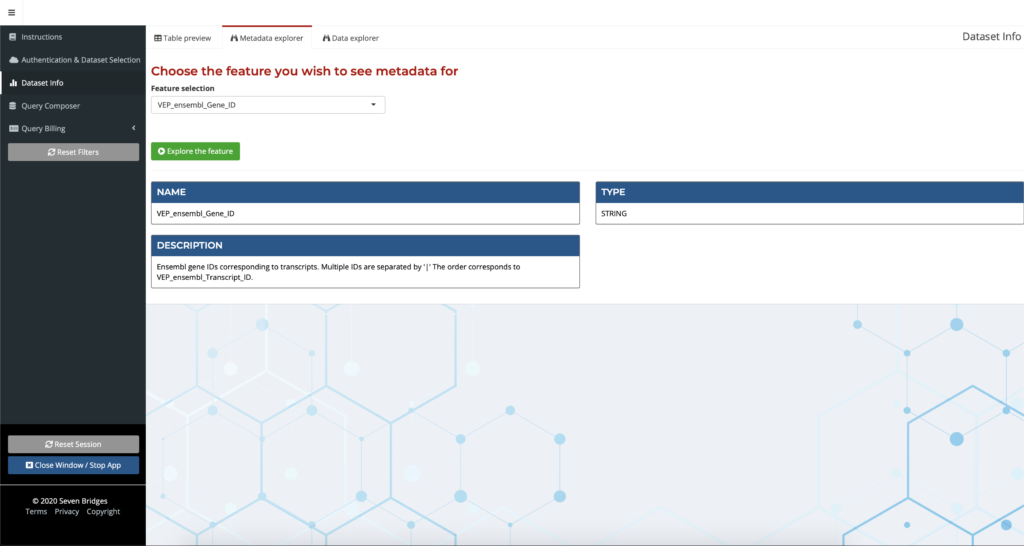
Figure 2: Getting started with the Annotation Explorer
Investigate datasets quickly and easily with the Data Explorer
Once a user finds annotation fields of interest on the Metadata Explorer, they can search the field name to find the summary information on the Data Explorer. Here, a user can examine a summary of data across the many TOPMed variants, all in one place. This feature presents a summary of the datasets, visualizations of quantitative data, and the various fields for datasets available, some as large as 5.8 Tb. This gives the users an overview of the information in a dataset, such as through summary tables and distribution plots of values for an annotation field, so that they can make better-informed decisions on how to best use this data, as shown in the figure below. Users do not need to annotate their own variants since the annotation data is already generated and available within the Annotation Explorer. The Data Explorer is also a powerful tool for researchers exploring a new dataset, to overcome the daunting task of dealing with a large volume of new information. No other interface available today provides the same streamlined high-level presentation of the data in this manner.
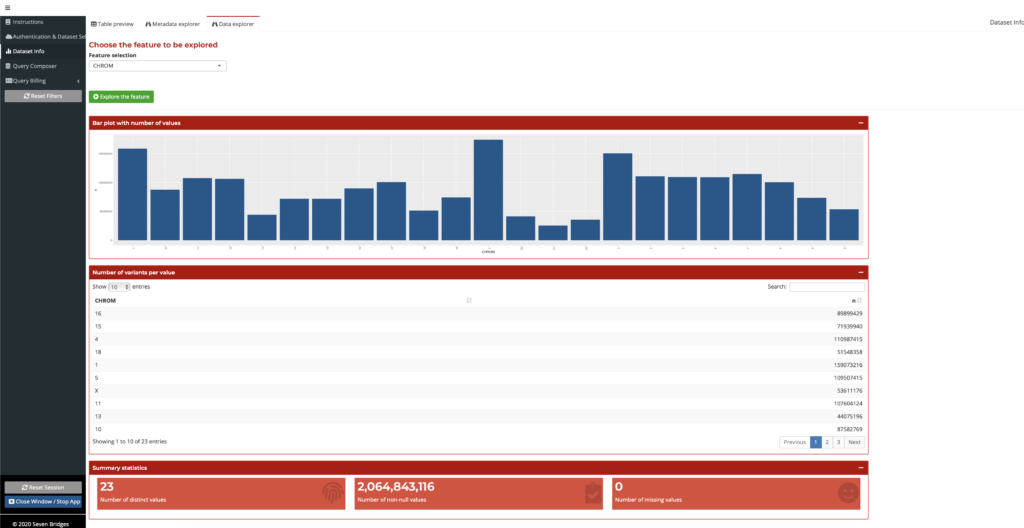
Figure 3: Summarized field information on the Data Explorer
Streamlined query creation with Query Composer
There are two options for querying the data – writing standard SQL in the SQL Query tab, or compose the query easily and interactively through GUI in the Query Composer. The Query Composer features tabs for Filtering, Aggregation, Interactive plots, and Exporting results. The GUI also features a field info helper which provides snapshots of useful data for each field, as shown below:
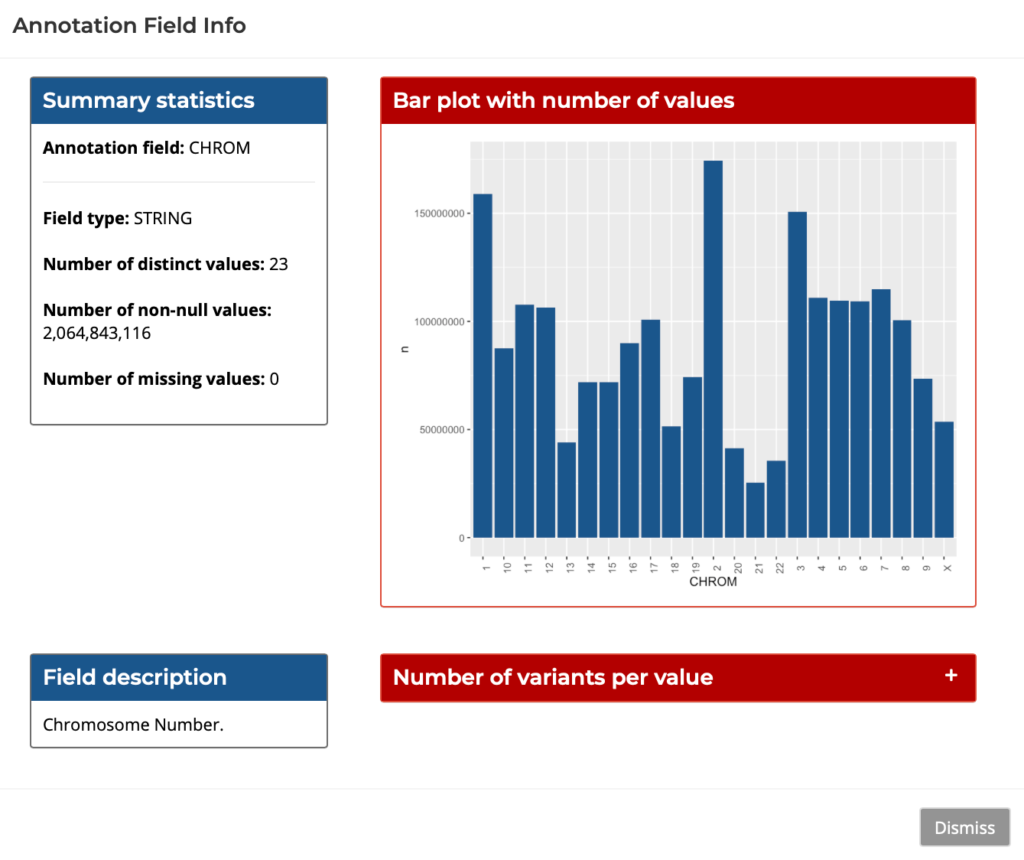
Figure 4: Query Composer’s Field Info Helper
Following the initial Query Composer step is Filter and Aggregate. Variants can be filtered by providing the desired annotation fields and filtering criteria. Then, these variants can be grouped either based on an annotation field, such as gene identifiers, or on user-specified genomic ranges. Query Composer’s Aggregation Tab provides the option to aggregate data using a BED file, or to Aggregate Manually. In this tab, users can see a subset of the data table (under Table Preview below) as well as summary information updated based on which annotation fields were selected.
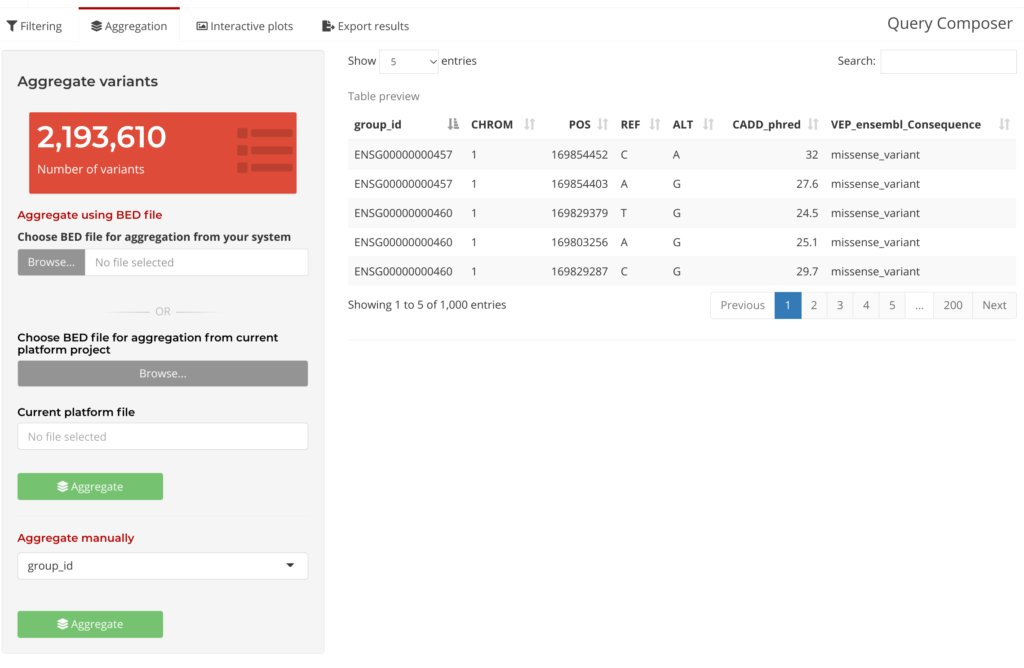
Figure 5: Query Composer Aggregation Tab
The Aggregate Manually option provides a series of drop-down menus to select annotation fields and their values by which to filter by. Users can add and remove filters are needed to help refine their query to their own specific requirements:
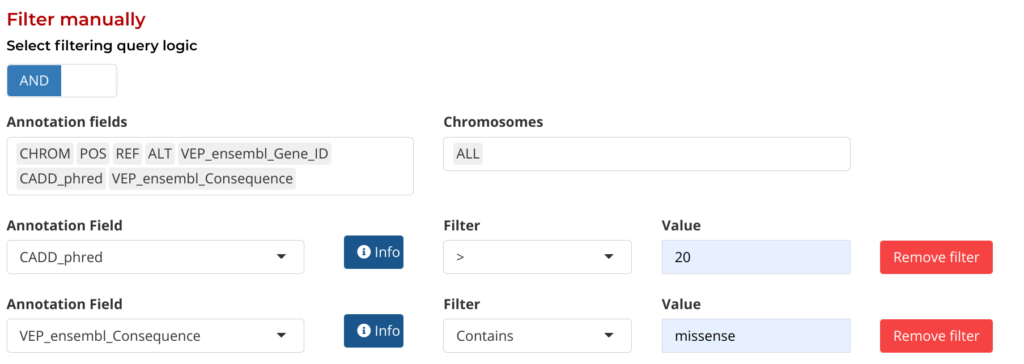
Figure 6: Manual Filtering by Annotation fields
Next, in Visualize and Review, interactive plots can be generated to study the characteristics of aggregation units (see Figure 7 below). After reviewing these plots, users can interactively iterate on the filtering parameters and generate new sets of aggregation units. The Annotation Explorer makes it easy for researchers to check back on their data at the Visualize and Review stage, and then quickly return to the Filter and Aggregate stage: editing parameters on-the-fly during analysis. Using this feature on the Annotation Explorer also has the added benefit of greatly reducing the overall duration for the analysis loop, from days to minutes.
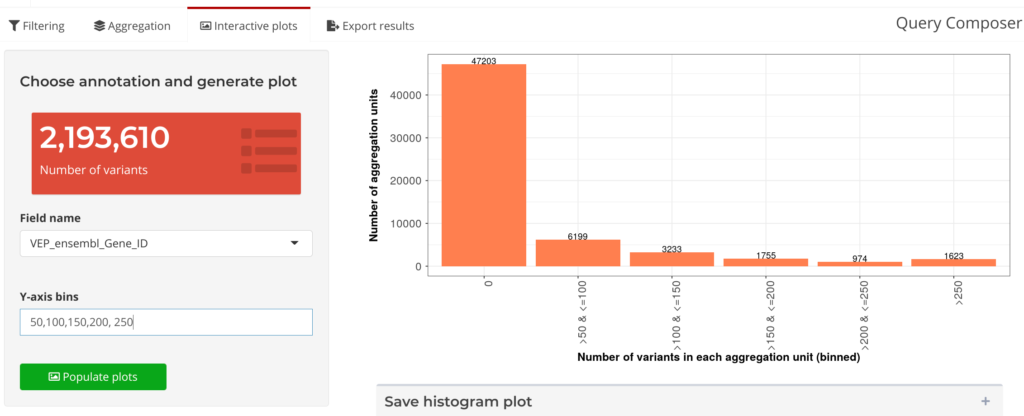
Figure 7: Query Composer’s Interactive Plots
Outputs from the Annotation Explorer can be saved in a format that can be plugged directly in the GENESIS aggregation testing workflow in the final step: Save Output. Users can also save annotation fields at this step to be used as weights in aggregate testing.
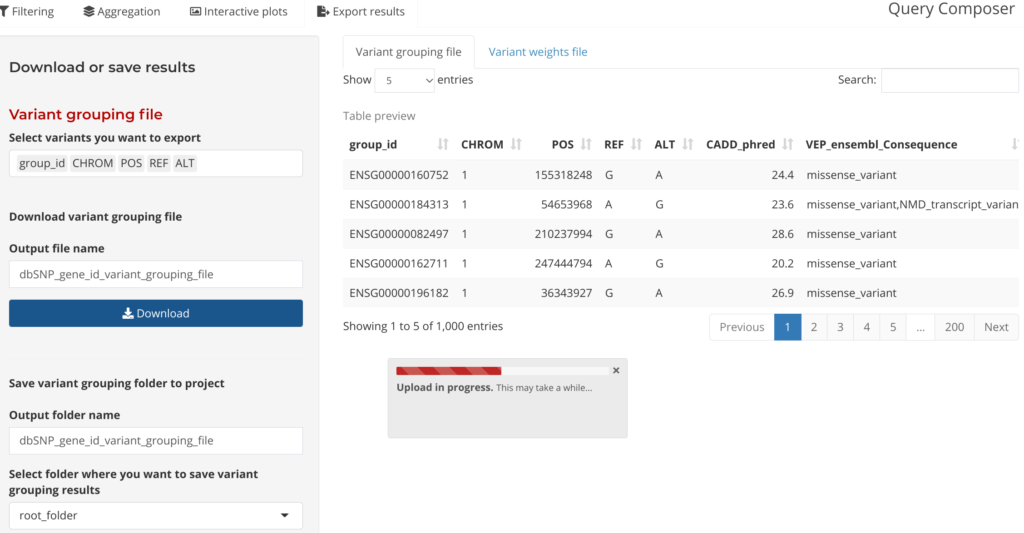
Figure 8: Download or saving results by variant grouping file
Lastly, to learn more about how to access and use the Annotation Explorer, please see the documentation. If you encounter any difficulties using the Annotation Explorer, email support@sevenbridges.com. To learn more about performing association testing with GENESIS workflows and the Annotation Explorer, please see our comprehensive GENESIS tutorial, and the Annotation Explorer’s Public Project Page.