Looking for an interactive variant association visualizer that produces publication quality plots?
GWAS results can be difficult to interpret, especially for those without a scripting background.
Genome Wide Association Studies (GWAS) has revealed loci associated with common human genetic diseases such as coronary artery disease in genetically diverse populations.Single variant association tests are used in testing for association between genetic variants and complex traits and calculate correlation and probability to a particular disease.
Velsera (Seven Bridges) released LocusZoom – interactive visual analysis software for Single Variant Association studies!
LocusZoom is an R Shiny app and part of the GENESIS variant association testing pipeline that provides publication quality plots of GWAS results. On the Seven Bridges platform, LocusZoom enables users to view the outputs of single variant association tests such as those conducted with GENESIS, GATK or EPACTS.
Test LocusZoom with included example datasets.
Let’s get started with the data! LocusZoom hosts example datasets from the University of Michigan (UM) database for users to explore. Users can easily follow the user guide to learn step-by step by process to use LocusZoom. To explore the app users can use the UM database or upload their own data. For the data from the UM database all the data layers are pre-filled.
Interact and visualize private GWAS data
If using your own data sources tab, select the existing association test results JSON file from the project and check any optional layers relevant to your desired outcome.
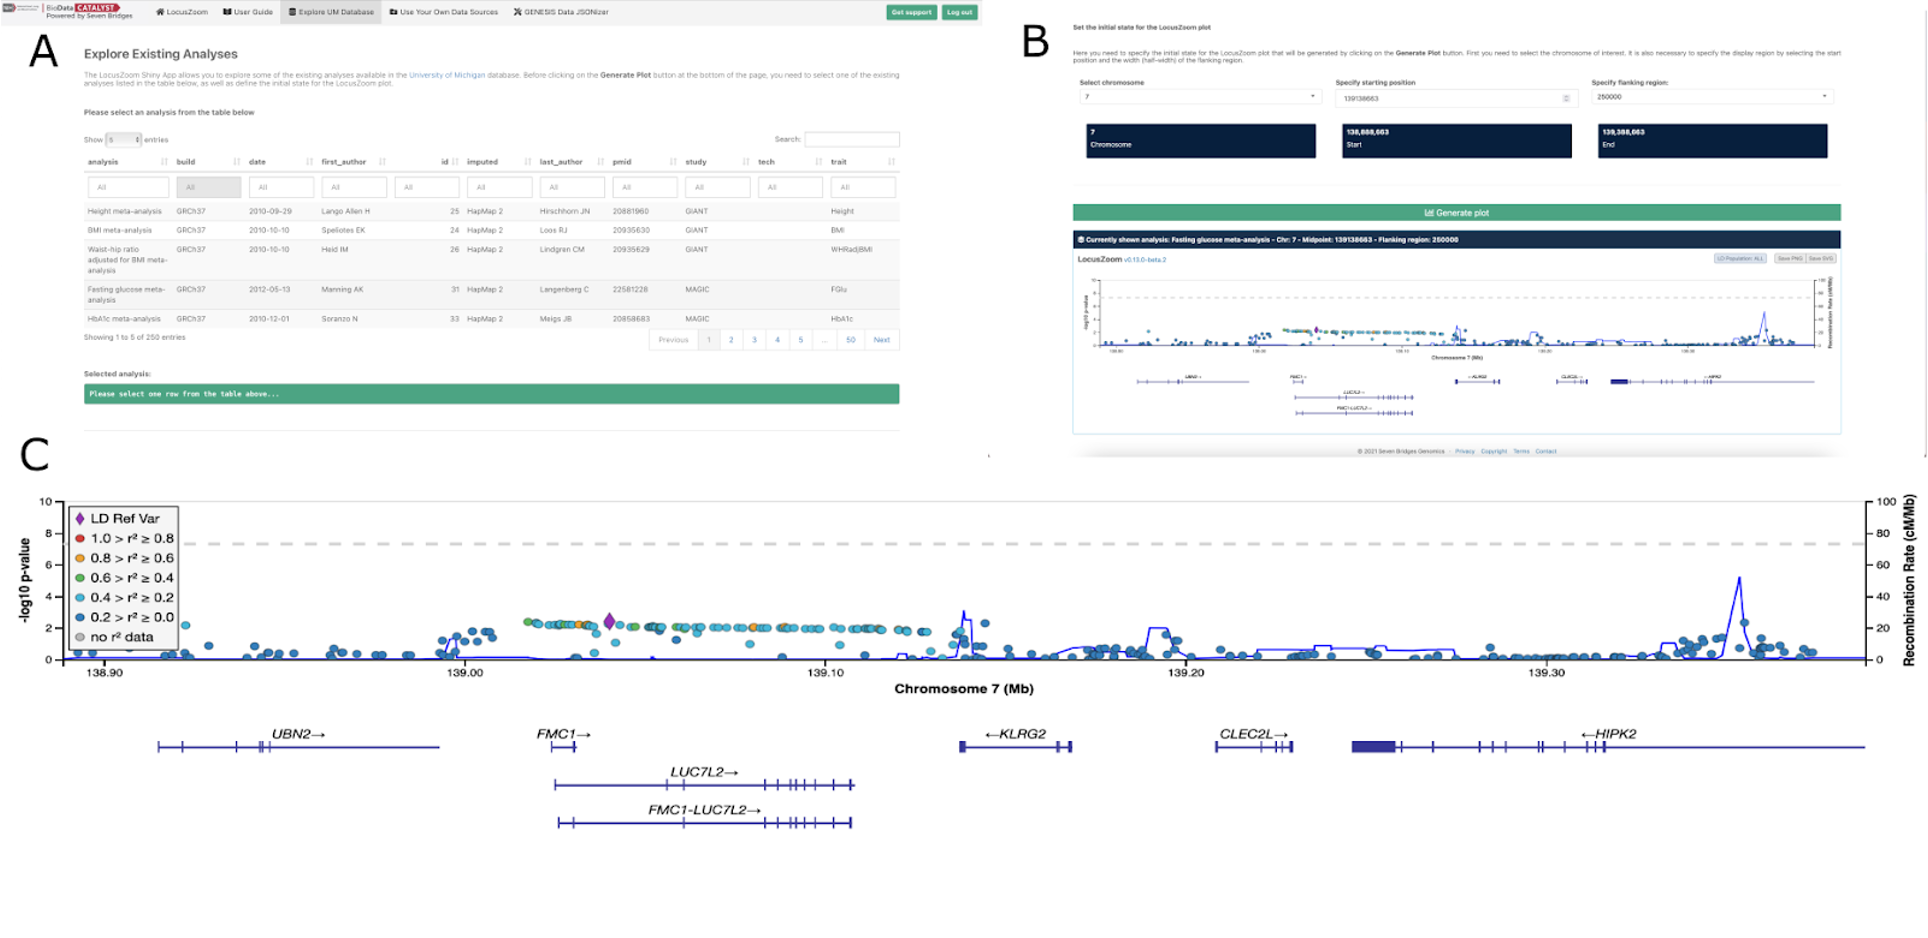
The above image depicts an example of LocusZoom plot for a fasting glucose meta analysis specifying chromosome 7. Figure A shows the LocusZoom data input dashboard allowing you to select existing datasets from the UM database. Figure B shows the initial state of the LocusZoom plot that allows you to select your desired chromosome, starting position and flanking region. Figure C shows the final plot as the resultant outcome(bottom panel). The y-axis shows the log transformed p-values. The points represent the Linkage Disequilibrium (LD) value between the SNP and the top SNP that is indicated by the purple diamond. If there are no LD values they are represented by gray points.
Export your publication ready plot
To export the image, just like any other software, select the filename and its extension along with the destination folder. Your plots are exported!
Get started by creating a platform account today!
For more information, please follow along with our detailed guide.
Questions? Send us an email at support@sevenbridges.com