Spatial Transcriptomics on the Seven Bridges Platform
As our understanding of biology deepens, many researchers are moving away from bulk gene expression analyses to single-cell analyses. However, current RNA-Seq methods that assay pooled RNA from tissue samples, or even from single cells, fail to conserve the spatial distribution of gene expression within the original tissue. In addition, analysis of differential gene expression in cancer vs. normal tissues is complicated by the need for potentially expensive microdissection techniques. On the other hand, in-situ hybridization of probes to RNA in intact histological sections provides spatial resolution but only a very limited view of gene expression due to limitations in probe multiplexing. Recently, a new technique, known as spatial transcriptomics, has been developed that can collect highly multiplexed, transcript-level information from individual cells within intact tissue without losing spatial positioning information (Ståhl et al. 2016).
Spatial transcriptomics allows for the characterization of gene expression in specific regions of interest, providing insights into transcriptional variation within tissue microenvironments in ways that were previously impossible. New offerings from the company SPATiAL Transcriptomics enable the construction of RNA-Seq libraries that are directly associated with histological imaging data, and here we describe an automated analytical approach that enables complete transcriptomic analysis within the full context of tissue morphology.
Analyzing the extensive data generated from combined RNA-Seq and imaging experiments is not trivial. Prior to now, demultiplexing and deconvolution of the resulting data required manual registration of the RNA-Seq and imaging datasets, which is prone to user error, labeling mistakes and long processing times due to many manual steps. Thus, an efficient, automated solution would improve data robustness, consistency, accuracy and scalability. Through integration of SPATiAL Transcriptomics reagents and tools with the proprietary image aligner Spotty on the Seven Bridges Platform, we now provide an end-to-end solution for the generation, efficient processing and interpretation of novel and powerful spatial transcriptomic datasets using a user-friendly interface on top of scalable compute resources.
A Hybrid Cloud Solution for Spatial Transcriptomics
Seven Bridges and SPATiAL Transcriptomics together have developed a sample-to-interpretation workflow that combines cutting-edge bench techniques with automated data analysis in the cloud and data visualization via a local desktop application.
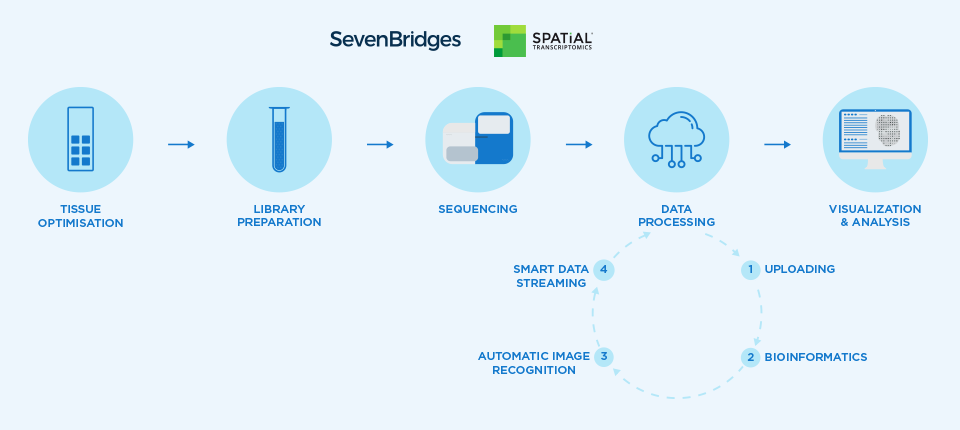
Briefly, the SPATiAL Transcriptomics assay kit provides glass slides with printed arrays of DNA capture spots. Each spot contains hundreds of millions of capture probes with unique barcodes to identify the location of each spot in the array. Fresh frozen histological tissue sections are imaged, applied to the slides, and permeabilized to release cellular RNA, which is captured in situ and then prepared as an RNA-Seq library. In addition, the slide is imaged to detect fluorescent labels to record the location of the arrayed spots. The method has been described in detail in the paper by Ståhl et al. (2016).
After sequencing, the RNA-Seq data and imaging data are uploaded to the Seven Bridges Platform. The RNA-Seq data are then demultiplexed and transcripts identified using the SPATiAL Transcriptomics bioinformatics workflow, which is a Common Workflow Language adaptation of the open-source Spatial Transcriptomics Pipeline that has been optimized for portability and reproducibility. In parallel, the histological images and fluorescent images are processed using Spotty, an automated image recognition algorithm that align the resulting images together and allows association of the RNA-Seq results with each spot. Lastly, the processed data, which are located in the cloud, can be mounted locally using the Seven Bridges File System (SBFS) and visualized using the Spatial Transcriptomics Viewer.
Our combined solution provides researchers facile access to this novel yet complex data type, backed by the power of cloud bioinformatics and a interactive user experience that enables local data visualization.
Analyzing Spatial Transcriptomics Data on the Seven Bridges Platform
The SPATiAL Transcriptomics data analysis workflow, shown in the image below, can be found in the Public Apps gallery on the Seven Bridges Platform.
The workflow requires six types of inputs:
- the tissue histology (HE) and fluorescence imaging (CY) microscopy images
- the forward and reverse reads of the RNA-seq library
- the reference genome sequence in fasta format along with the respective STAR index of the species of interest
- a GTF file with gene annotations
As a demonstration of this workflow, we describe here analysis of the published data, which you can find on the ENA website, from Ståhl et al. (2016).
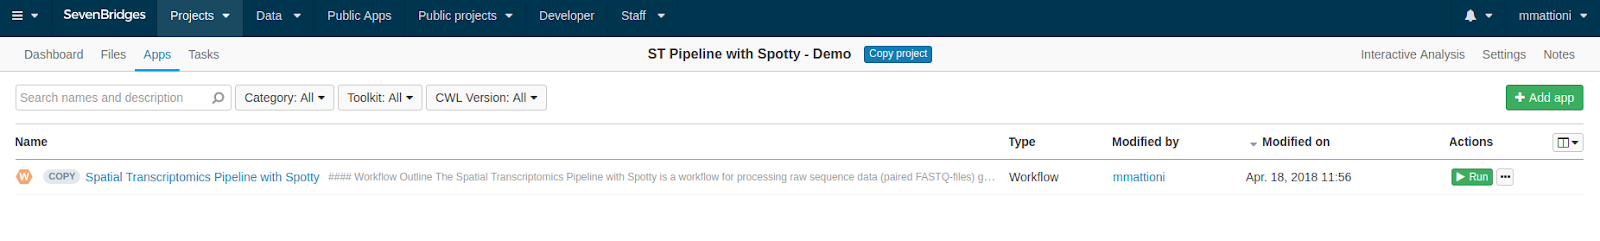
In this example we use mouse olfactory bulb replicate 11 as our input data. Once you have uploaded the data into your project on the Seven Bridges Platform, copy the ST Pipeline with Spotty workflow from our Public Apps gallery to your project and then click the Run button in the Apps tab of your project, as shown below.
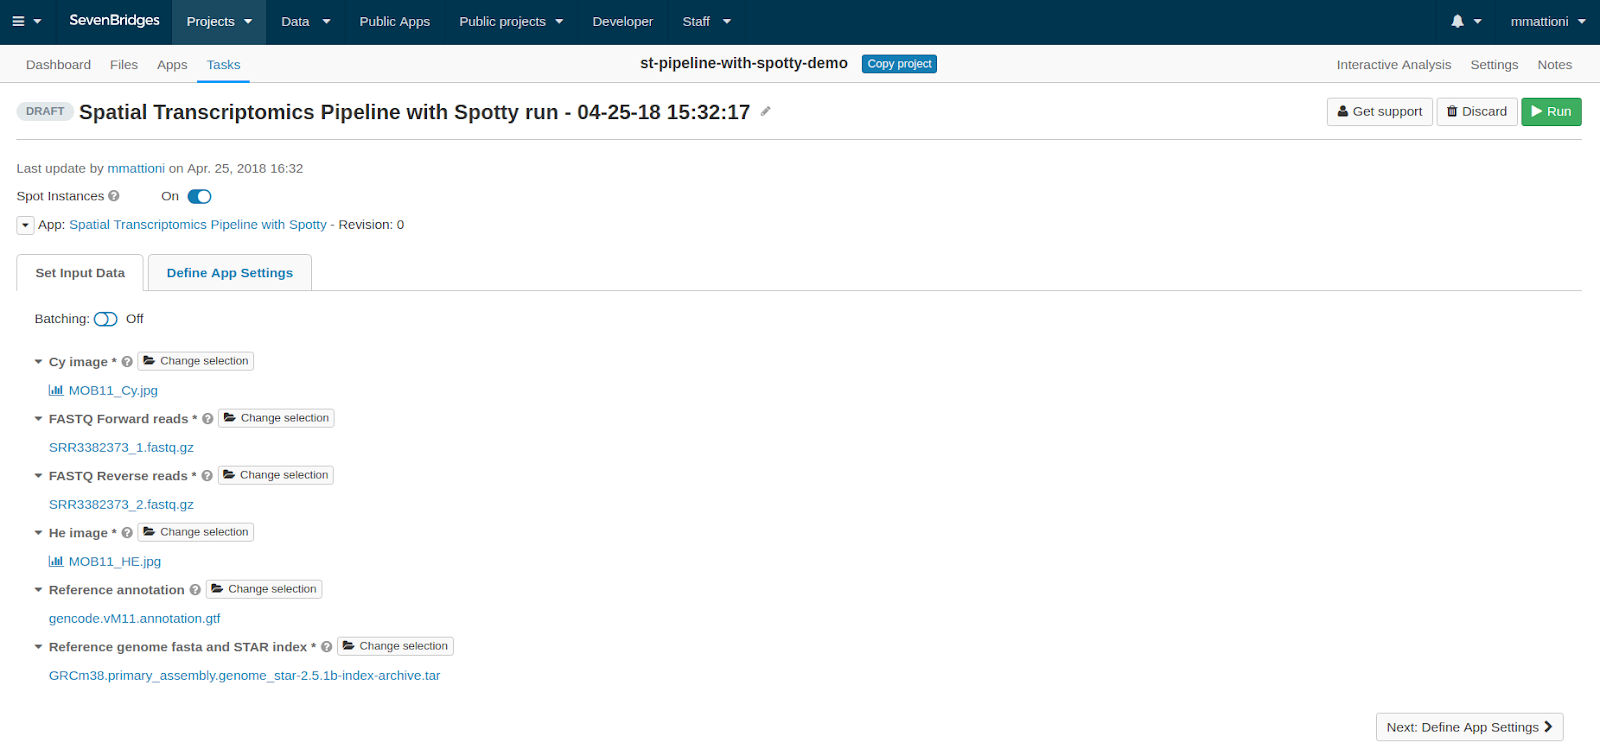
Once you click Run, you will be brought to the task creation page, where you can select the appropriate input files. These should be selected as follows:
- Cy image: the fluorescently labelled spot image
- He image: the tissue histology image
- FASTQ Forward reads and FASTQ Reverse reads: the RNA-Seq fastq files. (Note that the order in which you add the files does not matter.)
- Reference annotation and Reference genome fasta and STAR index: the relevant (species-specific) reference files for the dataset
In the Define App Settings tab, you will need to add the Batch number of your slide, which is provided by SPATiAL Transcriptomics. This number specifies the design of the index codon on the slide, which is used in the de-multiplexing step of the bioinformatics workflow.
Once you have all of the parameters and inputs set, click the Run button again to launch the analysis.
In the figure below you can see what a completed task looks like in the Tasks tab of your project.
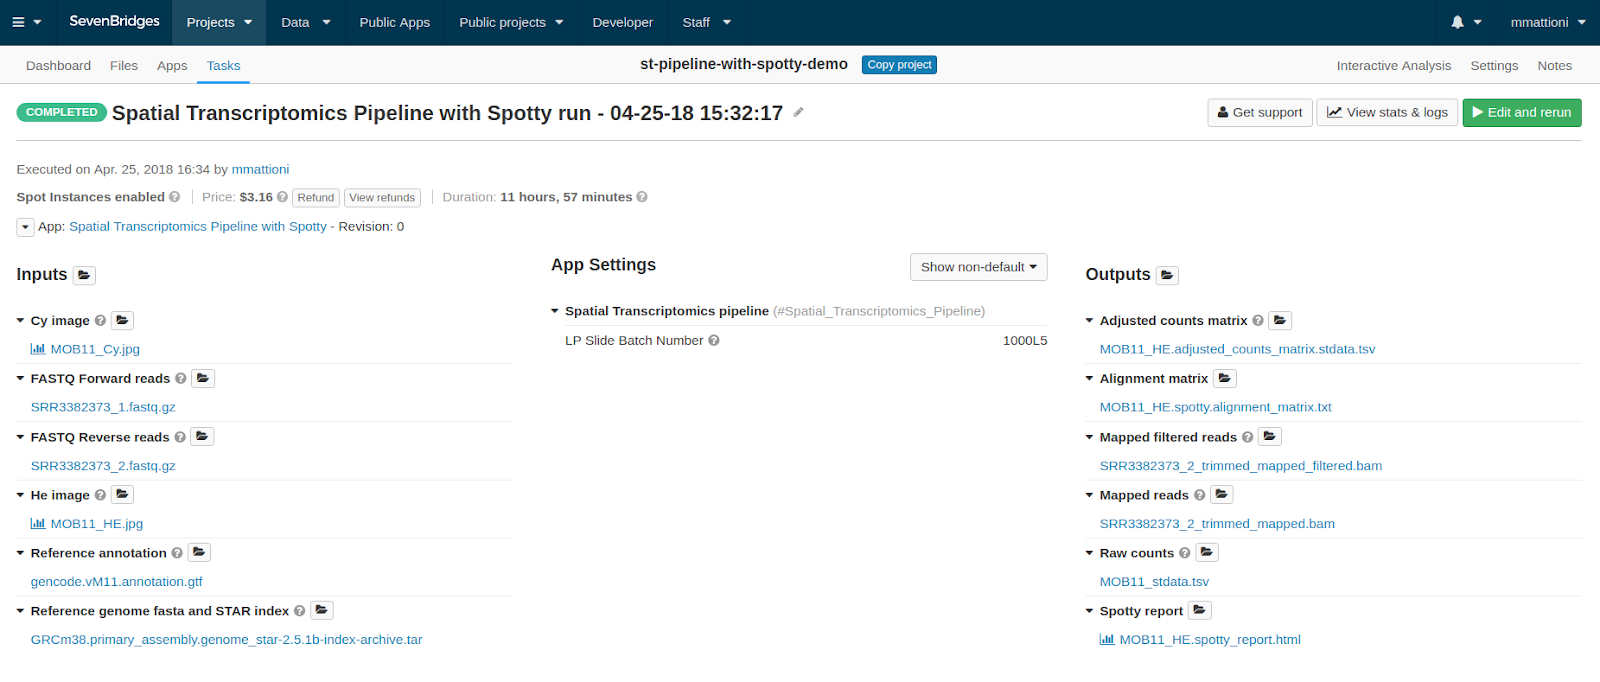
The three output files that we will concentrate on are the Spotty report, the Adjusted counts matrix and the Alignment matrix.
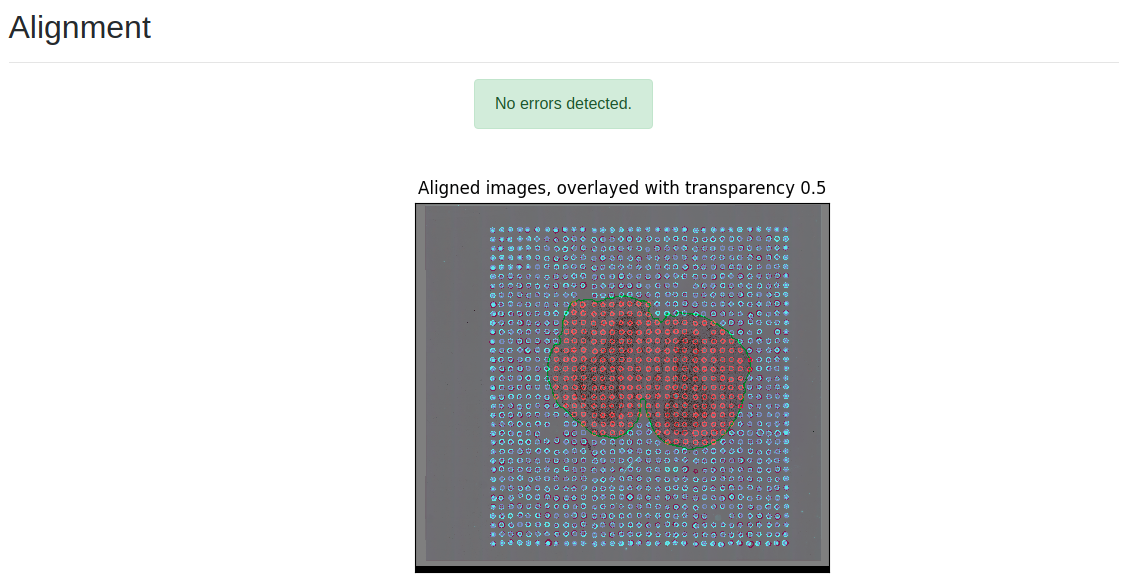
The Spotty report is produced by Spotty, a Seven Bridges software package that automatically recognizes the fluorescent spots in each of the two images and aligns them. Spotty is available exclusively on the Seven Bridges Platform, and it provides a critical tool for turning raw files into processed data in an automated manner. Below is a screenshot of the two images aligned and overlaid. The blue dots represent the spots coming from the fluorescently labelled image (Cy3), whereas the red ones represent the spots detected inside the tissue histology image.
Visualizing SPATiAL Transcriptomics Data using SBFS and the STViewer
The Adjusted counts matrix and the Alignment matrix output files can be viewed using the SPATiAL Transcriptomics Viewer (STViewer), a freely available desktop application. To access these output files, we use the Seven Bridges File System (SBFS), a command line tool that enables users to interact with files in a project on the Seven Bridges Platform, mounted as a local file system, from their local computer.
After you have installed and configured STViewer on your local computer, launch SBFS using the following command:
$ sbfs mount ~/SBG/sbfs_mount_point/
where ~/SBG/sbfs_mount_point/ is the dedicated folder for the mount point.
Now, launch STViewer, which will treat the ~/SBG/sbfs_mount_point/ as a standard local directory. For example, if you ran the Spatial Transcriptomics Pipeline with Spotty workflow inside the project myusername/myproject, you would be able to find all the input and output files in the directory ~/SBG/sbfs_mount_point/myusername/myproject.
After launching STViewer, open the Datasets view via the Views and Datasets menu items. Then, click on the icon with the downward-facing arrow. You should see the window shown below:
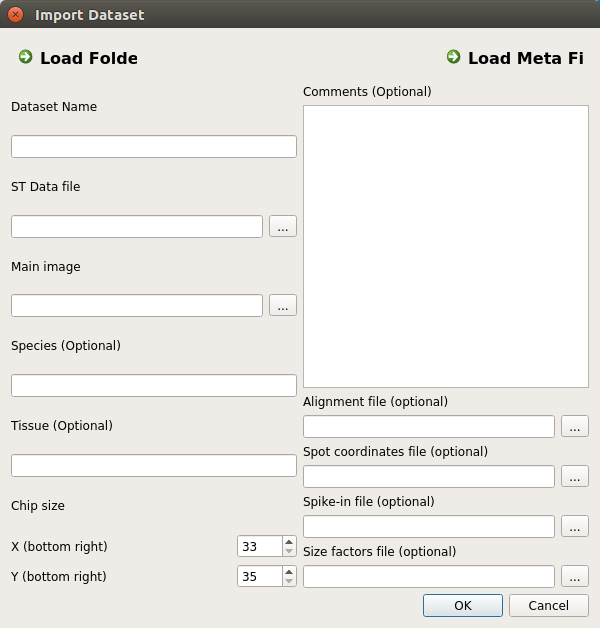
You now need now to provide the workflow input and output files, as follows:
- ST Data File (STViewer): the Adjusted counts matrix (workflow output)
- Alignment file (STViewer): the Alignment matrix (workflow output)
- Main Image (STViewer): the HE Image (workflow input)
Using SBFS, you’ll be able to access these files locally. For example, the ST Data File location, which in this example task is called MOB11_HE.adjusted_counts_matrix.stdata.tsv, is found at ~/SBG/sbfs_mount_point/projects /<username>/<projectname>/MOB11_HE.adjusted_counts_matrix.stdata.tsv. All the other files can be found on the same path.
Once you have provided these three files, click OK, and then double click on the dataset or select a dataset and use the icon with the upward-facing arrow to load it into the viewer.
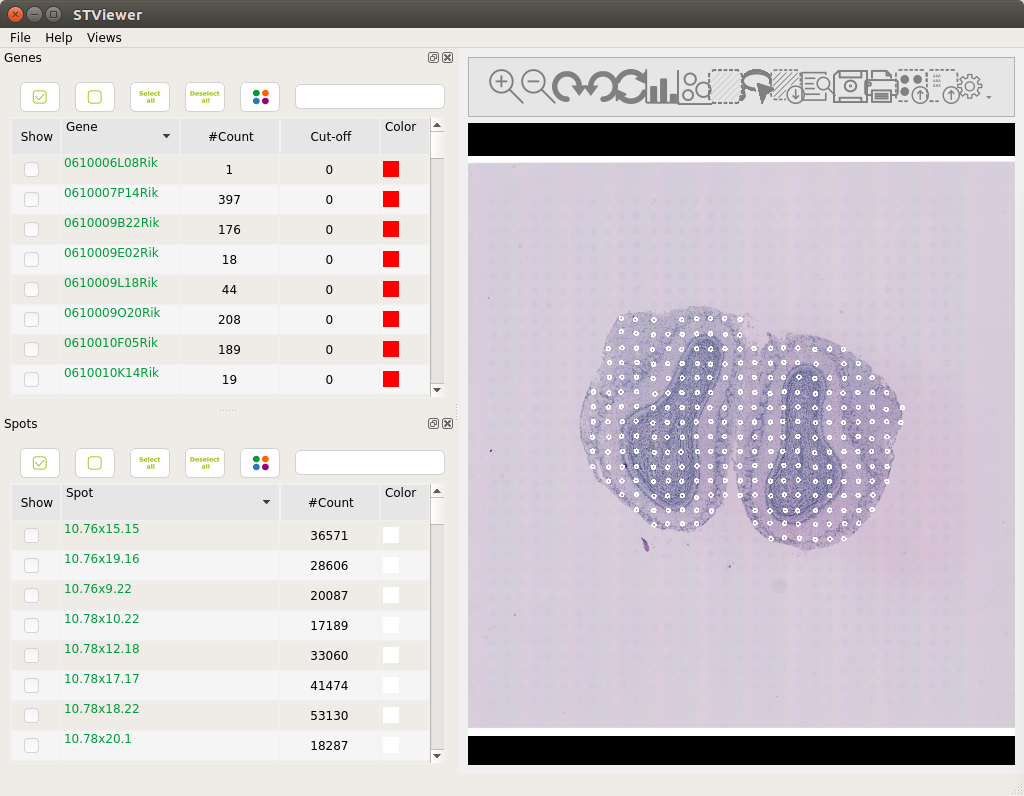
STViewer then will access the files, which will be streamed from the platform to your computer using SBFS. This may take a few moments. Once everything is loaded you should be able to see the image shown below:
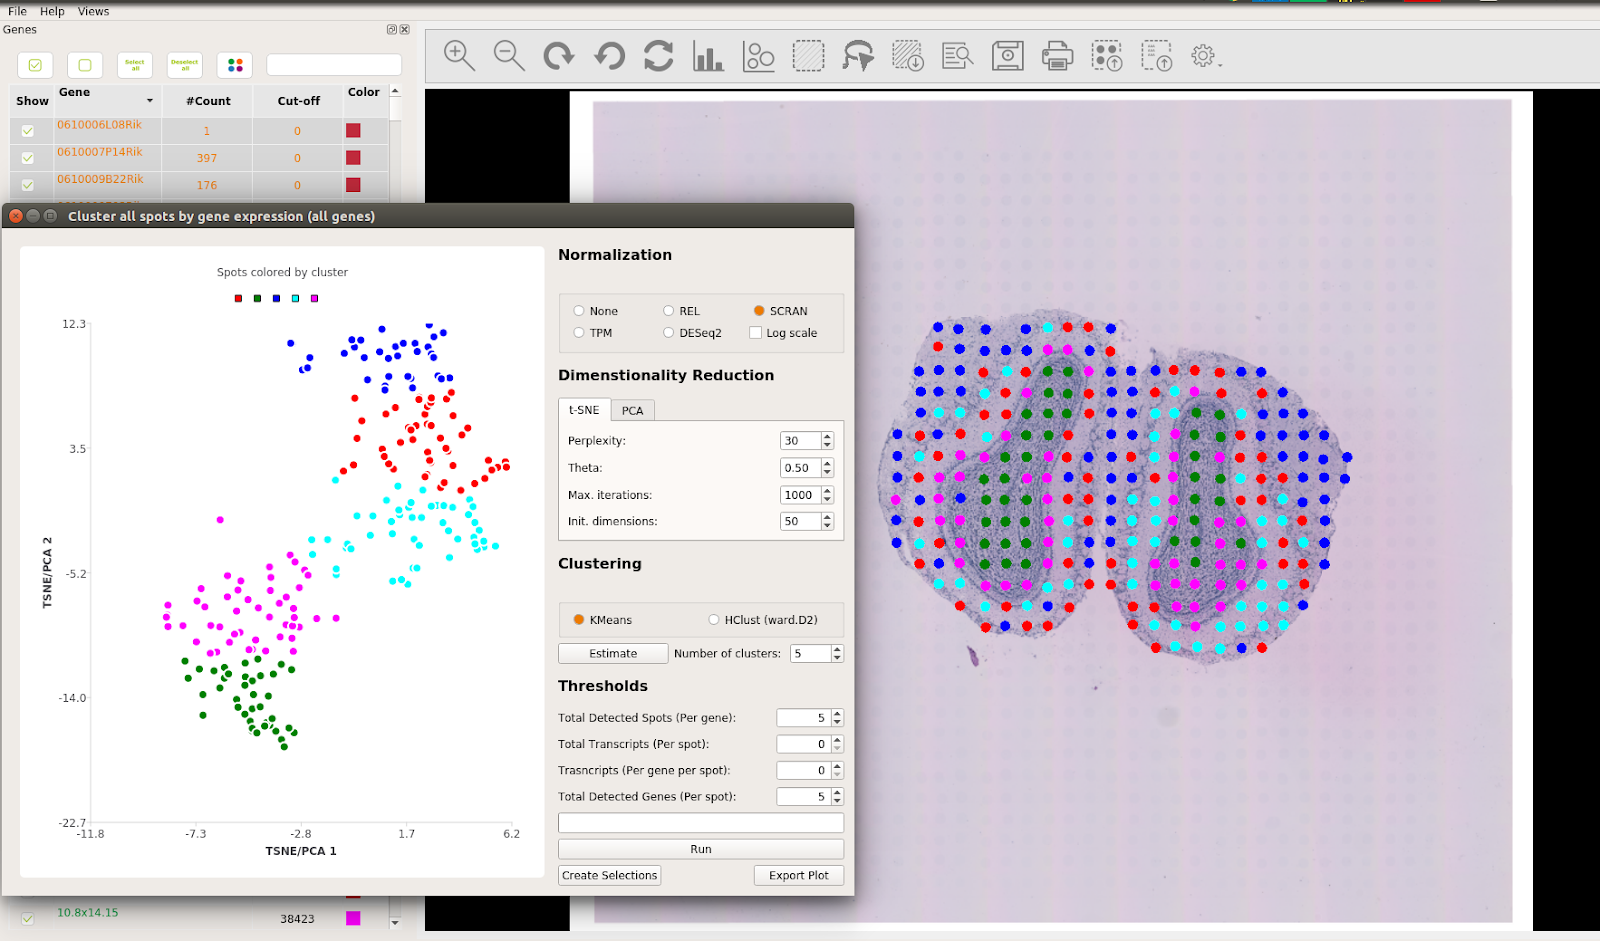
It also is possible to obtain a clustering of the gene expression values across the tissue using the clustering interface of STViewer. This will assign colors to the spots: first doing a dimensionality reduction (t-SNE or PCA) and then clustering (k-means or hierarchical clustering) the dimensionality-reduced coordinates to assign one color to each cluster. You can find more information on how to perform this in the STViewer wiki documentation.
Shown below are the results of clustering on all genes analyzed in this example dataset. If you are interested in exploring the expression of a particular gene, we suggest that you follow this example for the PENK and KCTD12 genes.
Enabling Spatial Transcriptomics
This solution developed by Seven Bridges and SPATiAL Transcriptomics provides researchers with a high-throughput and reproducible method for analyzing and viewing complex spatial transcriptomics data, and it is available today for users of the Seven Bridges Platform. If you are new to the Platform and are interested in using this workflow — or if you are an existing users who has feedback on this new workflow — we’d love to hear from you. Send us an email today at spatialtx@sevenbridges.com!