Harnessing the Cloud for Single-cell Research with the Seven Bridges Platforms
What is single-cell RNA sequencing analysis (scRNA-Seq)?
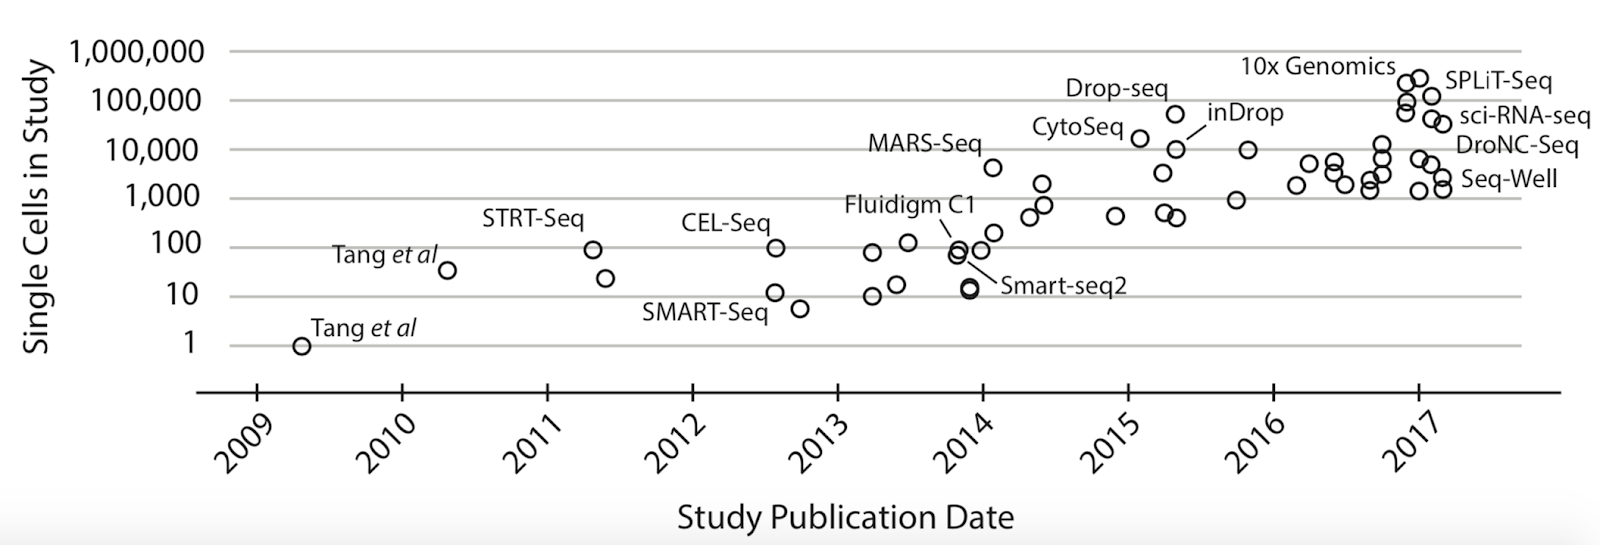
The popularity of single-cell methodologies has seen an exponential rise in recent years. Around 2010, the state of the art was examining only one cell by single-cell transcriptomics methods. Now we have the technology to analyze hundreds of thousands of cells in a single experimental procedure (Figure 1). With the improvements in technology for isolation of individual cells and expansion of single-cell datasets, a large-scale international project named Human Cell Atlas (HCA) was started in 2016. The Human Cell Atlas is a project with the goal of mapping all of the cells in a human being for the purpose of better understanding human health and disease. This molecular map would be a reference resource, with the cell type, location, and transcriptomic state for comparison. By employing the scRNA-seq analysis this project aims to find relationships between the molecular profile of cells, such as their gene expression, and the physical aspects of the cells, such as their morphology and location within a tissue. Furthermore, performing transcriptome analysis on the level of individual cells enables the identification of new cell markers and could lead to the discovery of novel cell types, positioning scRNA-seq as a promising new method for identifying and aiding in treatment of a disease.
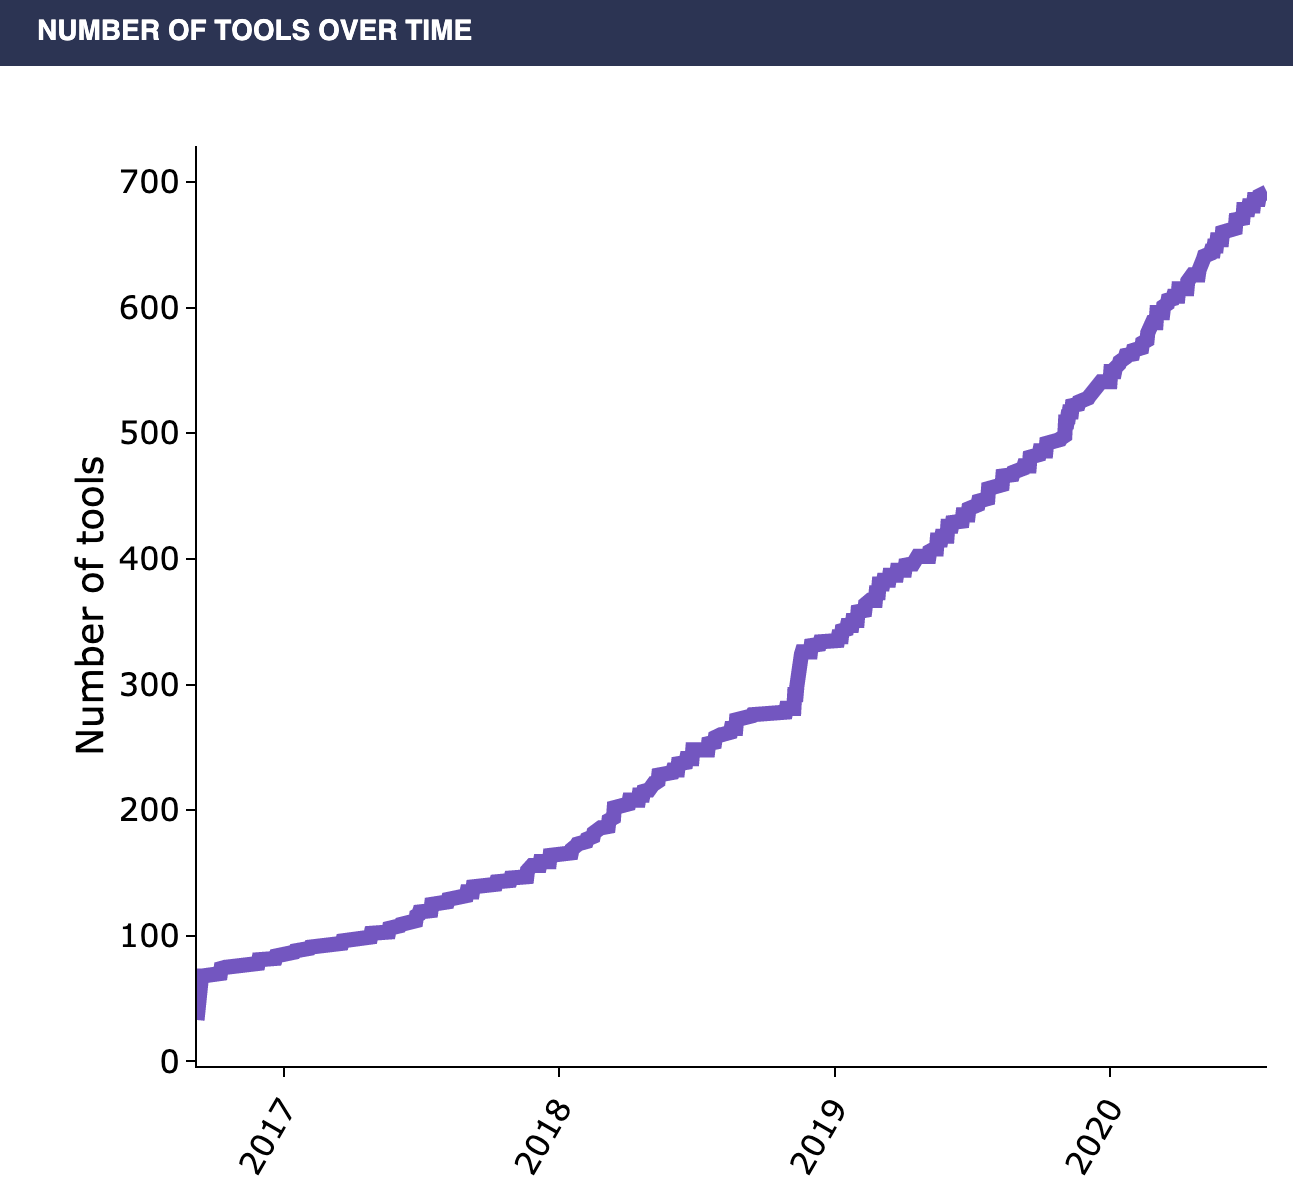
Why is the popularity of single-cell analysis warranted? The insights gained at the level of individual cells can help investigate the emergent properties of the heterogeneity in complex tissues. Nearly all fields of the biological sciences can benefit from this insight, as the emergent properties that come out from the heterogeneity present in complex tissues can often be responsible for the unsolved biological complexity that your research is focused on. For the cancer biologist, there are a wide-variety of scRNA-seq applications which can identify a subgroup of malignant tumor cells within a cancer. This could mean identifying groups of cells in a tumor that have undergone a certain mutation, in order to better identify a course of treatment. In the field of developmental biology, single-cell methodologies would allow lineage tracing of cells dividing and later differentiating into numerous cell types, providing an unprecedented ability to follow and understand the developmental trajectory of individual cells. Powerful insights could be gained in immunology as well: scRNA-Seq can be utilized for the identification of effector immune cells which undergo rapid clonal expansion during the immune response. Towards these aims, hundreds of single-cell RNA analysis tools have been developed in recent years (Figure 2).
Single-cell RNA sequencing analysis (scRNA-Seq) is applicable to various fields of biomedical science. Overall, researchers may consider performing scRNA-Seq in order to…
- Analyze the heterogeneity of different cells contained within complex tissues
- Observe the fundamental characteristics of gene expression of specific cell populations while removing biases caused by other proximal cell types.
- Identify marker genes for specific cell types by finding differentially expressed genes between different cell subpopulations
- Predict theoretical lineage trajectory for differentiating cells
Prior to the development of robust single-cell methodologies, transcriptome analyses were carried on large populations of cells, owing to the technological challenge of obtaining a sufficient amount of RNA molecules and quantifying them. Both hybridization-based microarray techniques and next-generation sequencing (NGS) methods provide average quantification measures of gene expressions of a sample, which obscures differences across various individual cell types within the same tissue. These methods do not take into account that gene expression in small populations of cells will be overshadowed by the expression profiles of the more prevalent cell-type populations, leading to misleading and inaccurate data. Single-cell RNA sequencing analysis presents a solution to this problem by analyzing transcriptomes of individual cells, which are then grouped into clusters based on similarities of their transcription profiles: isolating cell populations by type to reduce the effect of surrounding cells on gene expressions.
Challenges with scRNA-Seq, and how the Seven Bridges Platforms can help
Despite the recent progress in the development of single-cell research, there are still three major challenges to overcome to actually analyze and access the data. First, the scRNA-Seq datasets are large and complex, making accessing and processing them a challenging task. Second, the cellular data itself can be sparse: individual cells contain relatively little data compared to tissue-scale data, so traditional methods of doing RNA-seq analysis are often not optimized for use on single-cell datasets. Third, a consensus has not yet been established for many of the scRNA-Seq tools that have been rapidly developed in recent years, so it is challenging for a researcher to know which of these many tools is most useful (Figure 2).
Seven Bridges addresses all of these challenges through our innovative solutions to facilitate easier data access and more efficient data analysis. Our cloud-based infrastructure makes dealing with complex datasets less cumbersome. We host a suite of features to enable single-cell analysis on the platform, organized into tools workflows and interactive notebooks. On the Seven Bridges Platforms, tools are a single method for one step of an analysis. A workflow is a series of tools that can be connected together into such a pipeline for data analysis. All tools and workflows on the platform are wrapped in Common Workflow Language (CWL), which enables workflow portability and allows these elements to run on the cloud-based platforms as they would in any other environment. Additionally, Seven Bridges hosts the RStudio and JupyterLab servers, which enable the users to execute Python and R code and to create interactive notebooks.
Example Use Case: Identifying Cell Clusters and Marker Genes
In this article, we will explore just a few of the single-cell analysis packages we have on the Seven Bridges platforms. Many of the tools were first developed on the Cancer Genomics Cloud (CGC), before becoming available on all Seven Bridges platforms. It is also important to note that users can bring in their own tools, workflows, and packages onto the platforms as well.
One of the most common use cases for our researchers is identifying cell clusters and marker genes starting from raw sequencing reads produced with 10x Genomics scRNA-seq protocols. While the Seven Bridges Platforms have numerous ways to achieve this, this article will focus on a case study using the Cell Ranger 3.1.0 toolkit and the Seurat R-package. Another interesting use-case details the use of the Smart-seq2 workflow on dataset produced with Smart-seq2 full-length single-cell protocol. In this study, a single-cell dataset on the tumor microenvironment was processed with the Smart-seq2 workflow, in order to investigate changes in transcriptome profiles of endothelial tumor cells during tumor development. In this article, we will guide the reader through the first use case of Cell Ranger toolkit and Seurat R-package, and direct those readers who wish to learn more about the Smart-seq2 workflow and trajectory analysis to our upcoming white paper.
In order to demonstrate the value of single-cell research tools on the Seven Bridges Platforms, we will describe herein one of the most common use cases for our researchers: identifying cell clusters and marker genes from a 10x Genomics dataset. In this example, we utilized the publicly available Peripheral Blood Mononuclear Cells dataset of a healthy individual publically available at 10x Genomics website. The first step is to process the 10x Genomics data with the Cell Ranger v4.0.0 toolkit. The Cell Ranger v4.0.0 toolkit is a set of analysis tools that process Chromium single-cell RNA-seq output.
Cell Ranger v4.0.0 includes several tools relevant to single-cell gene expression experiments:
- cellranger count takes FASTQ files from cellranger mkfastq and performs alignment, filtering, barcode counting, and UMI counting. It uses the Chromium cellular barcodes to generate feature-barcode matrices, determine clusters, and perform gene expression analysis. The count pipeline can take input from multiple sequencing runs on the same GEM well. cellranger count also processes Feature Barcoding data alongside Gene Expression reads.
- cellranger aggr aggregates outputs from multiple runs of cellranger count, normalizing those runs to the same sequencing depth and then recomputing the feature-barcode matrices and analysis on the combined data. The aggr pipeline can be used to combine data from multiple samples into an experiment-wide feature-barcode matrix and analysis.
- cellranger reanalyze takes feature-barcode matrices produced by cellranger count or cellranger aggr and reruns the dimensionality reduction, clustering, and gene expression algorithms using tunable parameter settings.
- cellranger vdj takes FASTQ files as an input and performs V(D)J sequence assembly and paired clonotype calling. It uses the Chromium cellular barcodes and UMIs to assemble V(D)J transcripts cell-by-cell. cellranger can take input from multiple sequencing runs on the same library.
The commonly used tool is cellranger count that starts from the raw sequencing reads often placed in multiple FASTQ files. Cellranger count performs alignment and UMI counting followed by clustering and identification of differentially expressed genes among clusters. Even though cellranger count employs its own method for clustering, many users decide to use the qualification results produced with cellranger and proceed with downstream analysis using the Seurat R package (information here), as detailed in the next section.
In the table below, we have summarized the resources we found to have worked well to run the Cell Ranger count tool via AWS on different datasets using the Seven Bridges cloud environment. This table provides typical values for what you can expect running Cell Ranger via Seven Bridges for datasets of different sizes.
| Name | Size | Protocol | Price(on-demand/ spot) | Time (on- demand) | Instance |
| PBMC 1K | 5 GiB | 10x Chromium v3 | $4.80/$2.11 | 1:20:20 | m4.16xlarge(3200GB EBS, 64vCPUs, 256GB RAM) |
| PBMC 4K | 33.6 GiB | 10x Chromium v2 | $14.64/$6.13 | 4:01:00 | m4.16xlarge(3200GB EBS, 64vCPUs, 256GB RAM) |
| PBMC 8K | 69.2 GiB | 10x Chromium v2 | $27.16/$11.95 | 7:29:00 | m4.16xlarge(3200GB EBS, 64vCPUs, 256GB RAM) |
| PBMC 10K | 44.1 GiB | 10x Chromium v3 | $26.59/$11.53 | 7:18:00 | m4.16xlarge(3200GB EBS, 64vCPUs, 256GB RAM) |
The prices listed vary based on the selection of on-demand or spot instances. See the Spot Instance Advisor for more information regarding on-demand versus spot instances.
Alternative Tools and Performance Benchmarking
In addition to the commonly used Cell Ranger tools, Seven Bridges offers many alternative tools and workflows depending on your research and analysis needs. For processing UMI-based single cell data, the Seven Bridges platforms feature tools that are separated into two categories based on the alignment approach they use: alignment or pseudo-alignment. Alignment-based tools in addition to Cell Ranger, include zUMIs and STARsolo; tools that use splice-aware algorithm for aligning reads to the reference that is implemented in STAR aligner. For pseudo-alignment tools, Seven Bridges features extensions of Kallisto and Salmon alevin; tools that use a pseudo-alignment algorithm for single-step alignment and quantification optimized for single-cell data. For researchers needing tools to process full-length single-cell data, Seven Bridges also offers the Smart-seq2 workflow, and splice-aware aligners such as HISAT2 or STAR, which can be used in combination with quantification tools such as StringTie or RSEM.
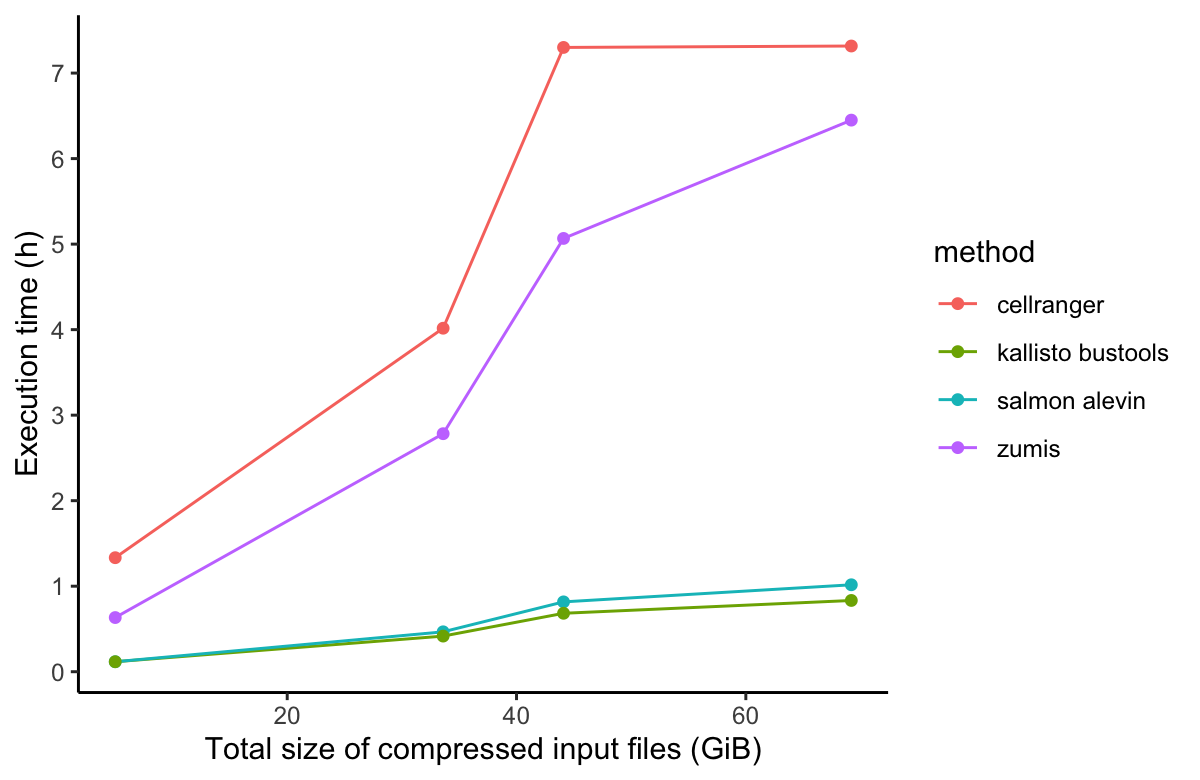
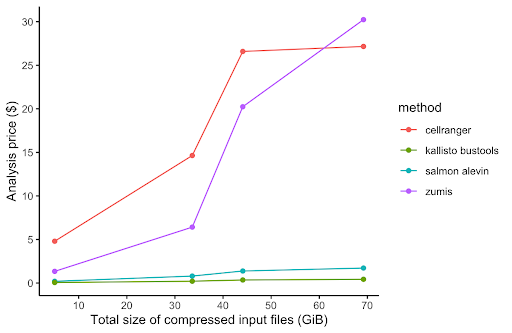
In order to compare the alignment and pseudo-alignment based tools, we performed benchmarking comparison of the execution runtime and AWS cost of four of the aforementioned scRNA-Seq processing tools (Salmon alevin, Cell Ranger, Kallisto, and zUMIs). For the performance benchmarking, we used the same PBMC dataset as with Cell Ranger above. We downloaded four PBMC datasets of different sizes ranging from 1k to 10k cells per dataset. The results of the performance benchmarking analysis is shown in Figure 3.
While alignment-based tools, namely Cell Ranger, had much better performance in runtime execution and computational resources (CPU and memory) usage on the Seven Bridges platforms, pseudoaligment-based tools are equally good and in some cases slightly better than alignment-based tools when processing 10x Genomics scRNA-Seq datasets. Nevertheless, we at Seven Bridges advise that Cell Ranger software should be used if you perform single-cell sequencing on 10x instruments that you own and possess required software license for, because Cell Ranger is optimized and extensively tested and validated on 10x data. A more in-depth discussion of performance benchmarking will be featured in our upcoming white paper.
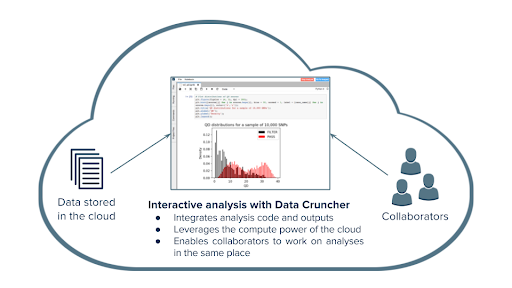
Single Cell Interactive Analysis on the Seven Bridges Data Cruncher
The Seven Bridges Data Cruncher enables the research community to collaborate, gain data-driven insights from their analyses, and refine hypotheses and targeted patient cohorts, together with the bioinformatics ecosystem (Figure 4). At Seven Bridges, our goal is to enable customers end-to-end solutions for the analysis of scRNA-Seq data produced with a wide variety of single-cell sequencing protocols. Towards this end, we developed the Single Cell Interactive analyses, available on Data Cruncher, which are executed within RStudio environment on the Seven Bridges Platform. Single-cell Interactive Analysis takes higher-level analyses and processes them into visualizations, or other types of biological focused analyses.
Once the user receives their gene-cell matrix output from Cell Ranger or similar workflow, they can utilize the three Rmarkdown notebooks to facilitate customized interactive analyses. These three notebooks contain the Harmony R package for the analysis and correction of batch effect, the Monocle tool for trajectory analysis, and the Seurat R package for performing clustering and detection of marker genes.
One of the most prominent uses of scRNA-Seq data analysis is to identify cell subpopulations within a heterogeneous population of cells. For this purpose, the Seven Bridges team designed an interactive analysis based on the Seurat R package1, which can be executed in the RStudio environment available on the Seven Bridges platforms. This interactive analysis can be used to import files produced with tools for scRNA-Seq quantification and perform clustering to identify cell subpopulations and gene markers specific to each.
The Single-cell Interactive Analysis consists of two independent analyses written in the RMarkdown document. To take into account the technical variability originating from different
batches, it is necessary to analyze and correct batch effects. With the first analysis, batch_effect_analysis.Rmd, users can explore batch effects in merged scRNA-Seq datasets. The second analysis, seurat_analysis.Rmd is an interactive document for single cell clustering and cluster marker identification, modified to accept gene-count matrix tables produced with Cell Ranger, zUMIS, Kallisto bustools, and Salmon alevin. It is also compatible with the objects created in batch_effect_analysis.Rmd analysis after correcting batch effects for further analysis. The input file for Seurat is a gene-cell count matrix produced as an output of other single-cell quantification tools described above. The Single-cell Interactive Analysis is capable of:
- dimensionality reduction and clustering
- visual representation of cell clusters in two dimensions, and
- identification of gene markers (finding differentially expressed genes between cell clusters).
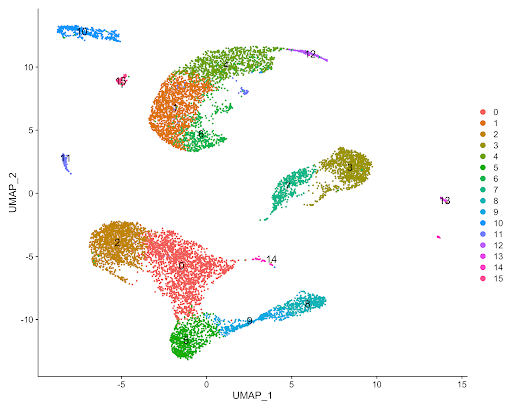
The figure below displays the output of the Seurat analysis of the 10x Chromium Peripheral Blood Mononuclear Cells dataset of a healthy individual, which was processed with Cell Ranger in the example below (Figure 5). By inspection, one can clearly observe several different cell clusters, some of which are representing a subcluster of a larger cluster of cells.
The wealth of information regarding cell clustering and marker gene identification in the above example is but one of the many potential applications of the Seven Bridges Single-cell Interactive Analysis. Nearly all fields of the biological sciences benefit from the insights gained from scRNA-seq and single-cell interactive analysis. Advances in scRNA-seq technology will allow for further understanding of the functional relationship between gene expression to cell morphology, enable the identification of novel cell markers, highlight potential drug targets, and more. Seven Bridges helps to realize the full potential of scRNA-seq research through our innovative solutions to facilitate easier data access and more efficient data analysis. Via our cloud-based infrastructure, we streamline dataset access and analysis, and also provide tools for single-cell analysis organized into workflows and interactive notebooks.
Interested in learning how to get started? Contact us today. Be sure to receive updates from Seven Bridges by following us on LinkedIn and Twitter.
Reference: 1. Satija, Rahul, et al. “Spatial reconstruction of single-cell gene expression data” Nature biotechnology 33.5 (2015): 495-502.