Accurate sequencing data analysis for under-represented populations: The Pan-African genome
We are excited to announce the release of our GRAF Population Solution, a set of tools, services, and workflows that enable the construction of genome graph references for targeted populations and/or studies. In this blog post, we discuss some of the advantages of population-specific graphs compared to methods that rely on linear reference genomes or generic pan-genome graphs. Make sure you check out our pre-print on bioRxiv for more information.
High-throughput sequencing data analysis methods rely heavily on the linear human genome reference whose composition is limited only to a few individuals of European ancestry, severely limiting its applicability to other populations with greater genetic diversity. Challenges such as reference bias become more apparent when a single linear reference is used for the analysis of populations distant from the said reference. Graph references provide an efficient framework for incorporating diversity into the linear reference while maintaining backwards compatibility with traditional tools. Graphs can also be tailored to be representative of a specific population and improve population genomics analyses by providing accurate alignment, higher sensitivity both across the entire genome and within functional regions, as well as enabling consistent genotyping across all samples in a given cohort.
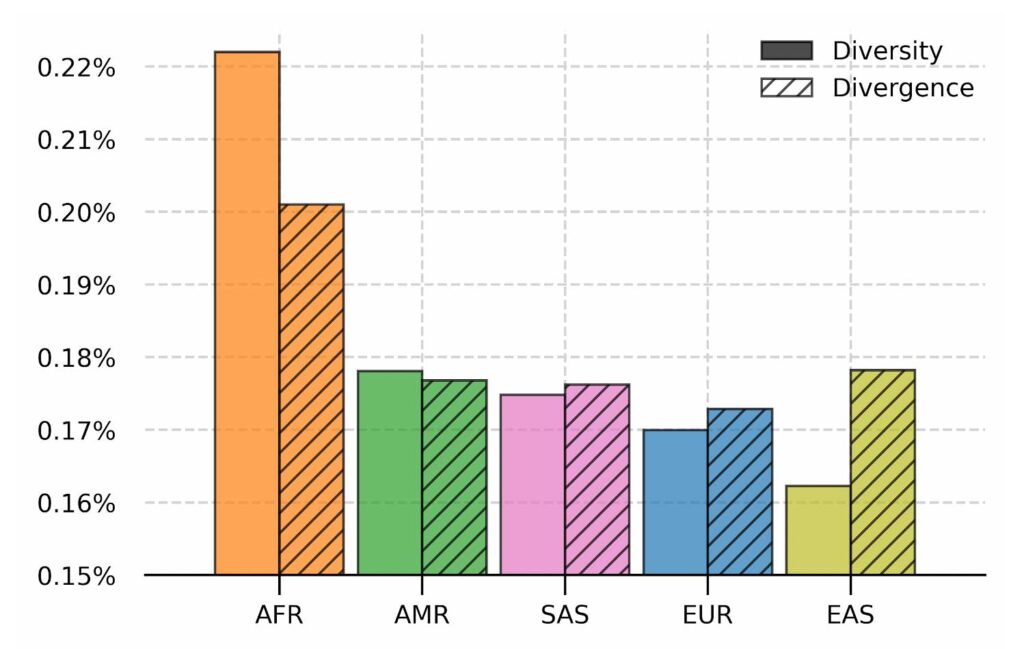
Nucleotide diversity and absolute divergence for populations in 1000 Genomes dataset. Nucleotide diversity measures the per base difference between samples in a population and absolute divergence measures the per base distance from the linear reference GRCh38 for the population. Populations are ordered from the most diverse to the least.
Constructing accurate and representative graph references is not a straightforward task. Therefore, our graph construction pipeline is designed to alleviate issues such as harmonizing common variations from different sources, integrating alternative contigs as variations, as well as further pruning graph edges (SNPs, INDELs, and structural variations) to enhance performance and accuracy. The details of this graph construction method are available in our manuscript , which discusses sample selection based on population diversity, graph curation by iteratively extracting genetic information from the population, and graph pruning to resolve reference ambiguity.
To demonstrate the effectiveness of population-specific graphs, we constructed a Pan-African genome graph using the high coverage samples from the 1000 Genomes project. A subset of the samples are reserved as a benchmarking group and the rest are used for graph construction. The performance of the Pan-African graph on the benchmarking sample set is compared to the standard linear reference approach BWA+GATK and the Pan-Genome graph which contains genetic information from all populations around the world.
Population-specific graphs reduce alignment errors and reference bias
Alignment is commonly the first step in genomic analyses and relies on the reference genome being representative of the sequenced sample. As the difference between the sample and the reference increases, aligners struggle to correctly align reads that support the alternate haplotype as opposed to the reference haplotype: a problem also known as reference bias. This problem subsequently leads to reduced variant calling and genotyping accuracy, deteriorating the efficacy of any downstream analyses.
By incorporating relevant genetic variations, population-specific genome graphs make pertinent alternate haplotypes accessible to the aligner, effectively removing the bias towards the reference sequence and reducing alignment errors overall. Using the Pan-African genome graph, we were able to reduce alignment errors by 50% as compared to the linear reference approach. We can also see that the Pan-Genome approach achieves an error rate between the linear and the Pan-African approaches, highlighting the utility of population-specific graphs.
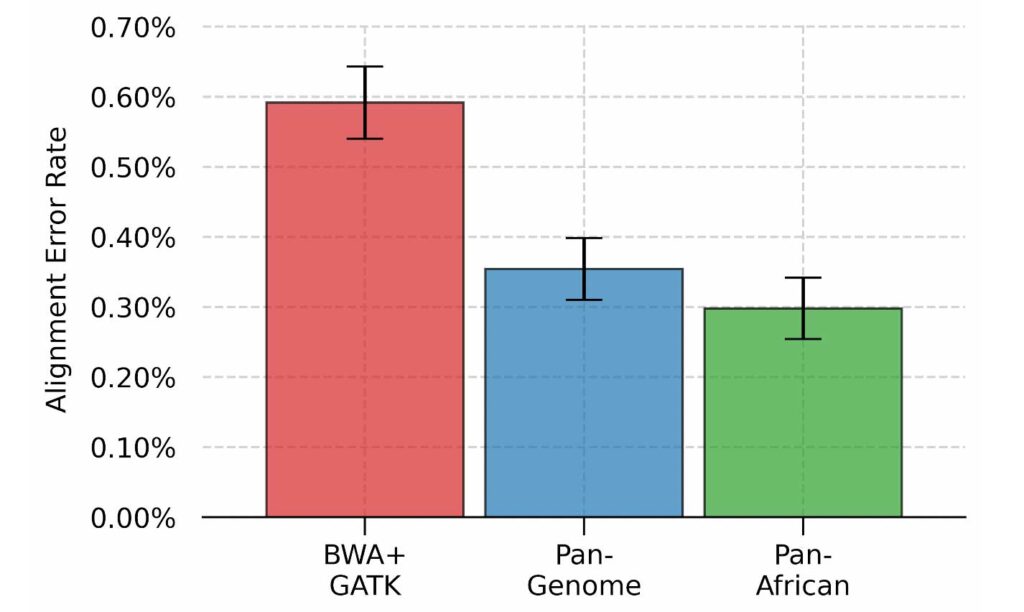
Per-base alignment error rate for three different approaches.
Population-specific graphs enable sensitive variant calling
Next, we measured how variant calling performance is influenced by the aforementioned changes in alignment. An important difference in our GRAF variant caller compared to conventional callers is the capability of using graph edges and other associated information such as allele frequency during reassembly and variant calling.
The number of SNPs, INDELs and SVs (structural variants) are shown in the figure below. We can see that a population-specific graph significantly improves the variant calling sensitivity when compared to other approaches. In our recent paper, we discuss the genomic distribution and clinical significance of these novel variants, and show their potential impact for tertiary analyses.
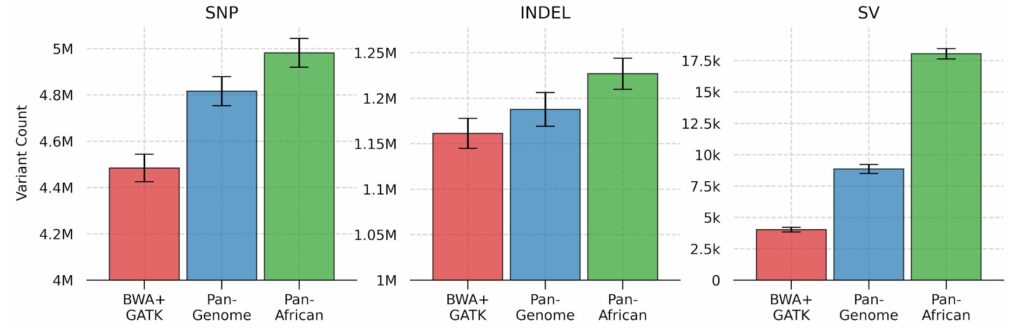
Variant counts for SNPs, INDELs and structural variants
We observe a more dramatic difference between the number of SVs called by each pipeline. The detection of SVs is facilitated by augmenting the graph reference with large population haplotypes that are missing from the reference backbone (GRCh38, in this case). As a result of this augmentation, GRAF aligner can align corresponding reads to these haplotypes which, in turn, are genotyped by GRAF variant caller. The size distribution of genotyped SVs (see below) indicates that the linear method is more or less limited by the read pair fragment size, as expected. The Pan-African graph contains SVs relevant to the African populations and therefore enables the detection of a higher number of SVs with larger sizes.
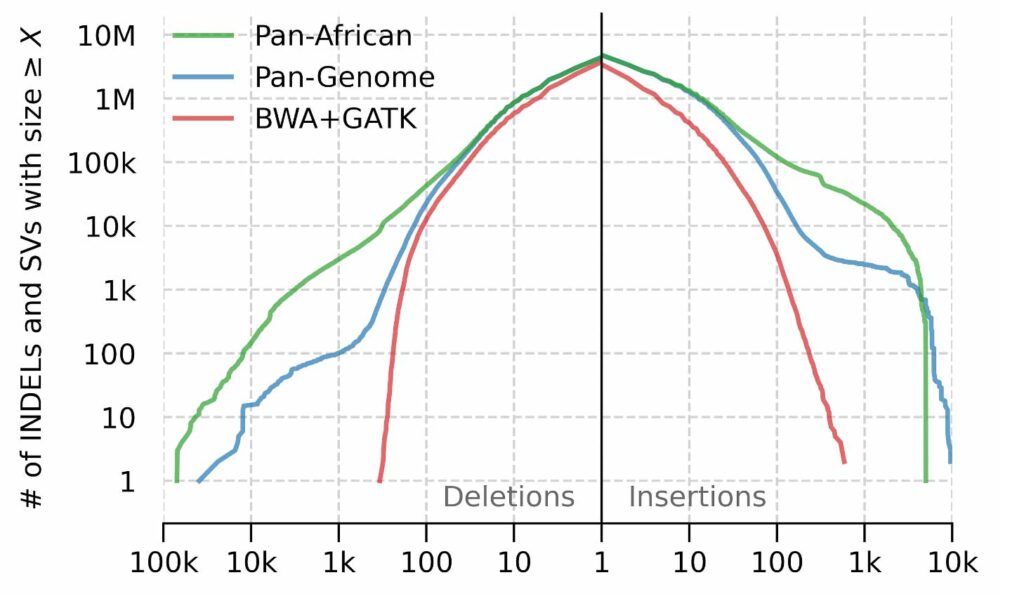
Structural variant and INDEL size distribution
Population-specific graphs as an alternative to joint calling
The traditional approach for analyzing a large number of samples is to perform joint calling, which uses population-wide information to enhance genotyping at the individual level. However, this information is readily available in our population-specific graph references and, unlike joint calling, it can be utilized during both read alignment and variant calling. The figure below shows the overlap between GRAF calls and the variants that are “recovered” by joint calling, normalized by the latter. GRAF can confidently genotype 80% of the variants recovered by joint calling while calling only 20% of the variants that are filtered out by Variant Quality Score Recalibration (VQSR), which is also the standard variant filtering method for a large number of samples. These results indicate that a population-specific graph can provide both sensitivity and specificity advantages of joint calling and VQSR without requiring a computationally intensive post processing step.
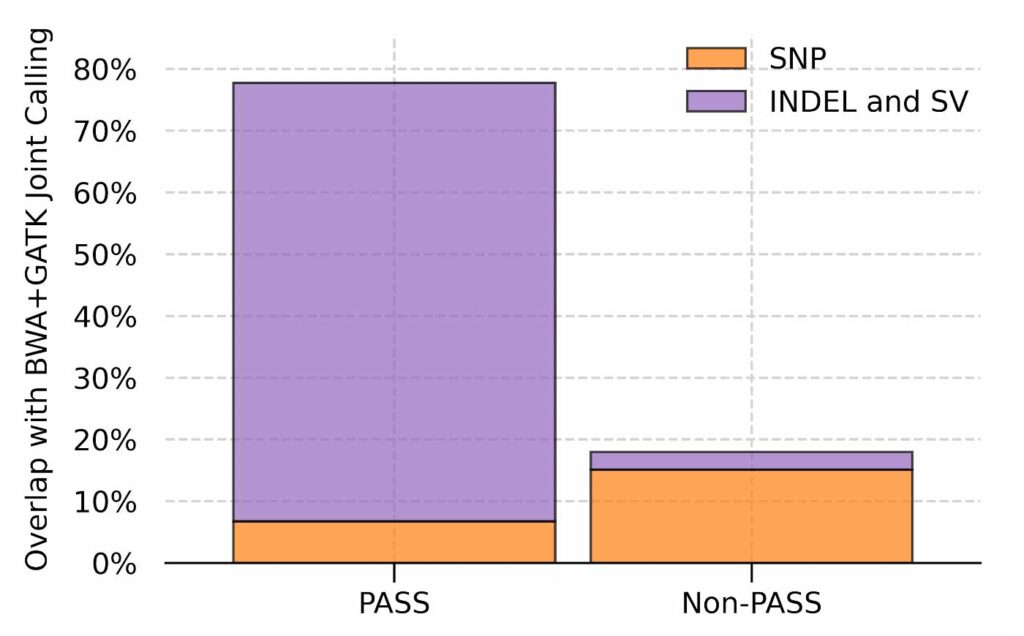
Fraction of variants called by graph on single samples out of the variants rescued by joint calling. Results are split based on the filtration output of VQSR on the joint called results.
GRAF Population Solution at Seven Bridges
The above was just a quick preview of what we can offer at Seven Bridges. Make sure you visit our website and read our preprint to find out more about population-specific genome graphs. The GRAF team at Seven Bridges has already constructed five different genome graphs using our proprietary graph construction method for the following populations:
- Admixed American
- African
- East Asian
- European
- South Asian
These genome graphs are immediately available for use with our GRAF workflows. We also provide GRAF Construction Services to extract genomic information from your own data and construct a genome graph tailored to your specific use case. To learn how to get started, Contact Us today.