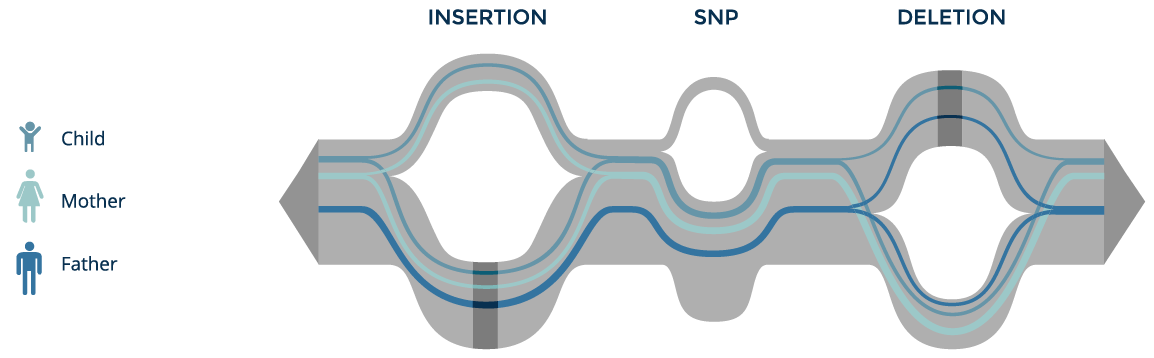
From genomic variants to a graph
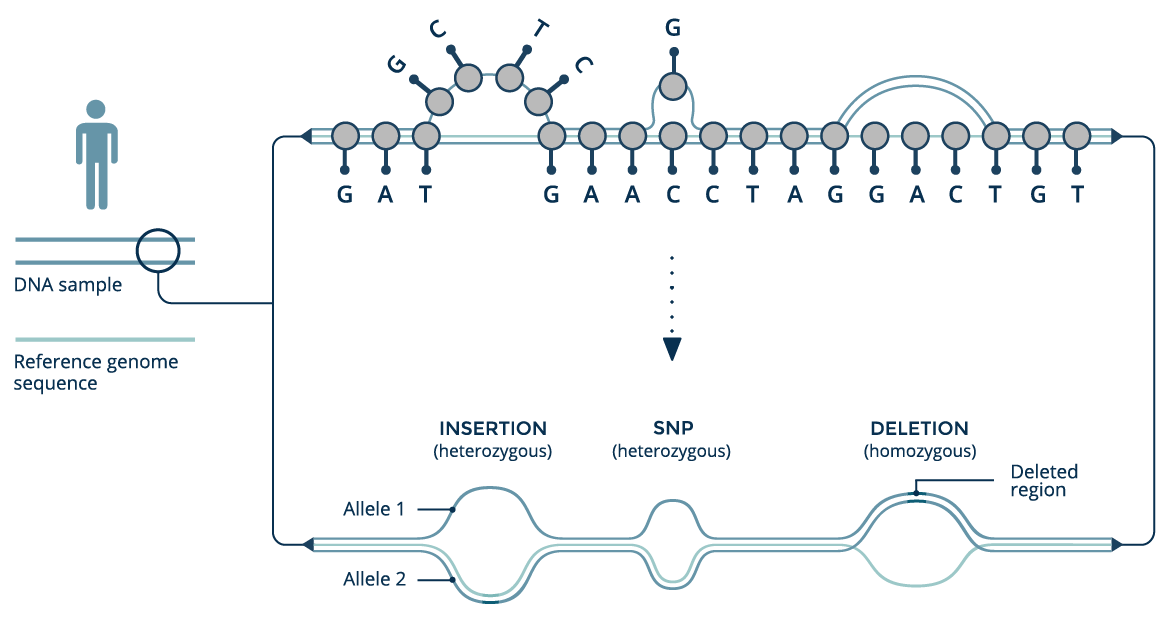
Conventionally, reference genomes are recorded as long sequences of letters representing DNA. At locations along the sequence where multiple variants occur in a population, only a single allele is selected for the reference. This simplifies the representation, but at the expense of throwing away diverse population information.
We can build a genome graph by starting with a conventional genomic reference sequence, and adding new variants as additional branches, which depart from the reference sequence but later rejoin it. The power of the graph structure is that is can be updated as new haplotypes are discovered.
World population graph
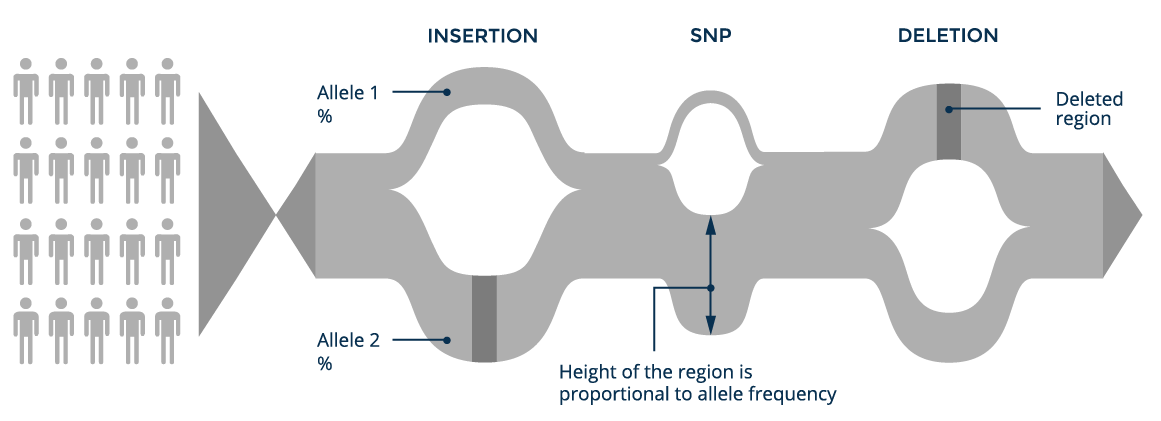
If we take all the genomic information available worldwide and put it into a single graph structure, we can build a world population or pan-genome graph. Each branch has an allele frequency associated with it, which measures how often it appears in the individuals included in the graph.
Individual tracing
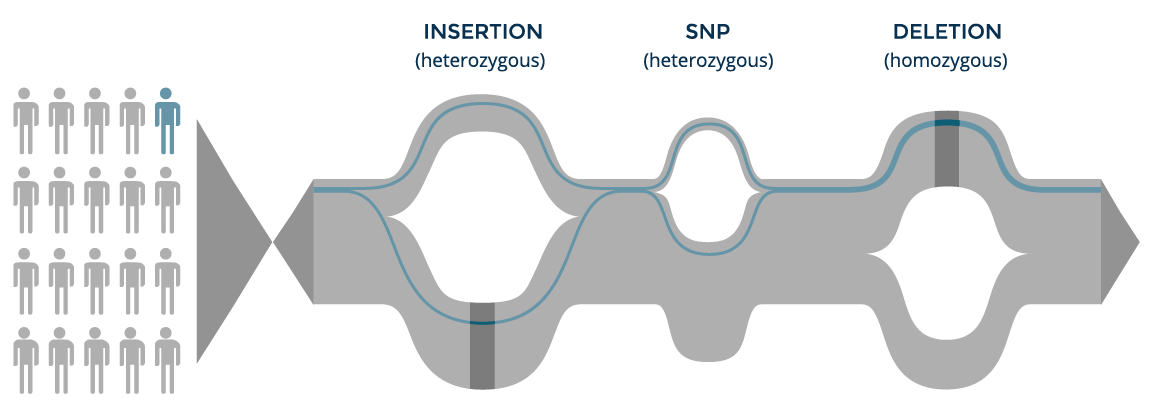
The genome of each individual is a set of paths along the population graph and can be tracked to compare his or her variants and their allele frequencies to the population frequencies. On the other hand, each individual can be anonymized by not storing path information, whereby his or her variants are aggregated to the population graph with no link to the individual.
Population tracing
With a pan-genome graph, we can not only track a single sample, but also trace the structure of whole subpopulations on the graph and compare their allele frequencies and linkage structures.
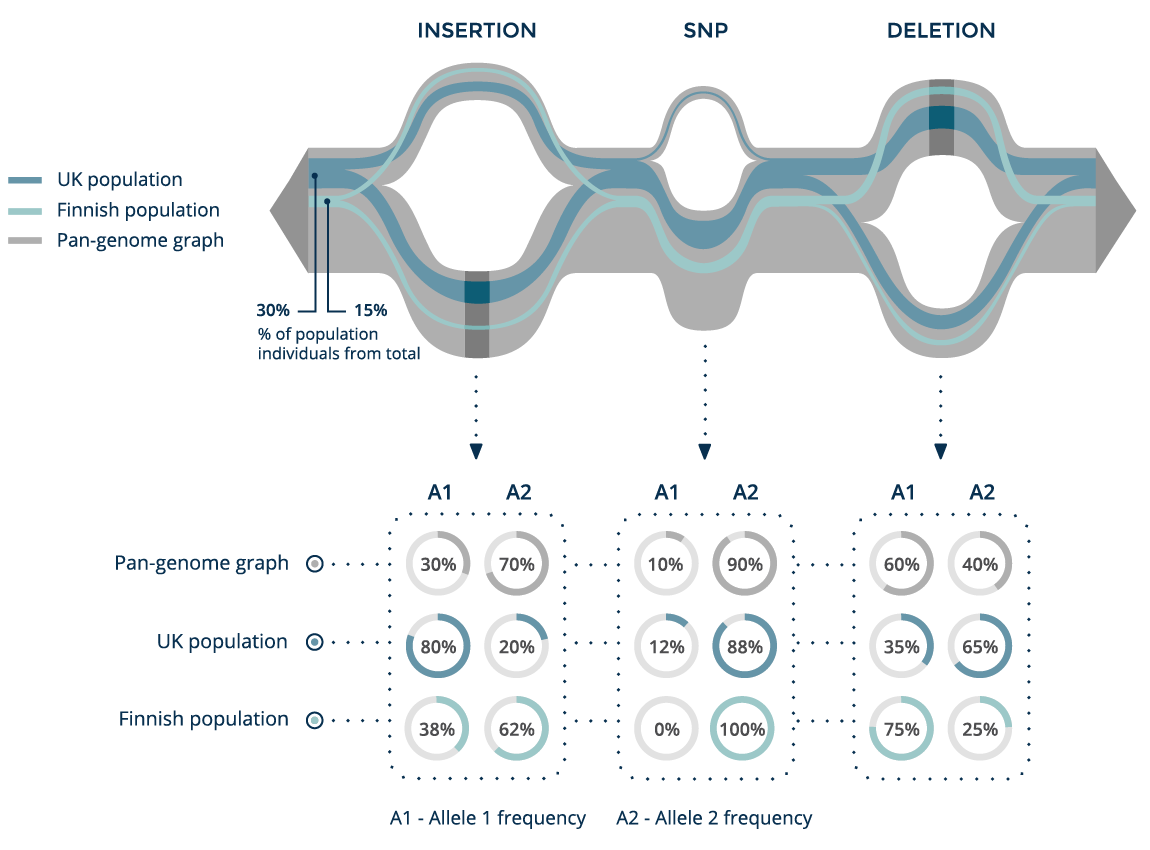
Here we can see two populations, together with the allele frequencies of each of their variants. This type of analysis can be used to identify a rare SNP that is present in the UK population but absent in the Finnish population.
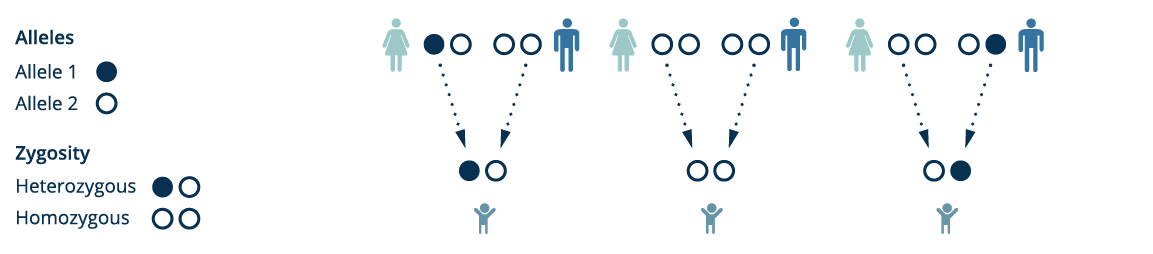
Family trio tracing
We can track the paths of individuals from a family trio on the graph, define the zygosity of their variants and inheritance of the variants in the child. By inspecting the much smaller set of location where genomic read sequence data fails to match the graph, we can also quickly narrow down the novel mutations observed in the child.
By preserving population scale genomic variant information in a single data structure, the pan-genome graph provides an intuitive representation for genomic data and a powerful tool for new discovery.